
RSI Above 70: Why “Overbought” Does Not Always Mean Sell
An RSI reading above 70 is often described as “overbought.” It is a momentum observation, not a command to sell and not proof that a reversal is imminent. In a strong trend, RSI can remain elevated while price continues to rise; in a range, the same reading may behave differently.

What RSI is measuring
Relative Strength Index (RSI) is a momentum indicator that compares the speed and magnitude of recent price changes. SEBI Investor describes readings above 70 as overbought and below 30 as oversold. NSE’s technical-analysis material likewise notes that RSI is used to evaluate momentum and that it tends to work better in ranges than in trends. Read SEBI Investor’s technical-analysis overview and NSE’s RSI learning material.
The label “overbought” does not say why momentum is high, how long it may persist, whether liquidity is adequate, or what an individual investor should do. It should start a review, not replace one.

Trend context changes the meaning of a threshold
During a sustained upward move, repeated high RSI readings may reflect persistent buying pressure. A premature sell decision based only on one threshold can ignore the broader trend. Conversely, a high reading beside weakening price structure or a change in broader conditions may warrant closer analysis—but still does not produce a guaranteed outcome.
NISM describes RSI as a momentum oscillator based on comparative price velocity and places it within a wider technical-analysis toolkit. See NISM’s technical-analysis explainer. SEBI’s due-diligence guidance also encourages investors to consider company financial health, historical data and corporate announcements rather than relying on a single input. Read SEBI Investor’s due-diligence guidance.
An illustrative chart: axes and inference
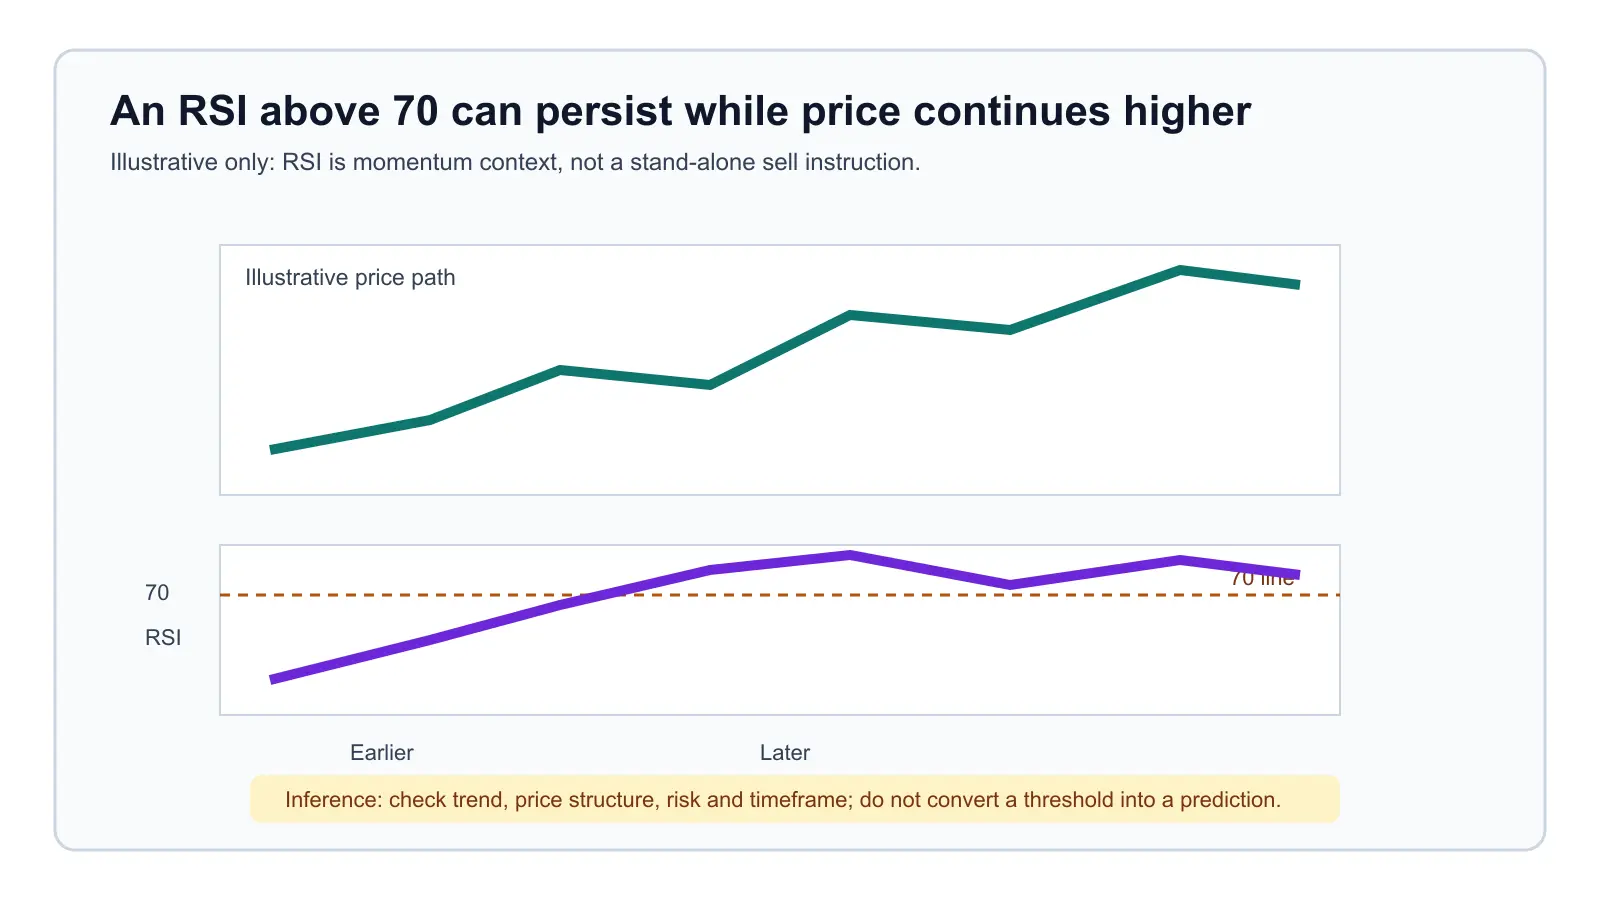
The horizontal axis is time. The upper panel is an illustrative price path; the lower panel is illustrative RSI, with the dashed line marking 70. The RSI remains above 70 while the example price path continues higher. The inference is deliberately narrow: a high RSI identifies strong recent momentum, not a certain reversal, sell signal or forecast.
| Check | Why it matters |
|---|---|
| Timeframe and settings | A reading depends on the selected period, chart interval and data feed. |
| Trend and structure | A range-bound market and a persistent trend can produce different RSI behaviour. |
| Risk and suitability | Costs, liquidity, position size, financial goals and risk capacity cannot be inferred from an indicator. |
A measured RSI review workflow
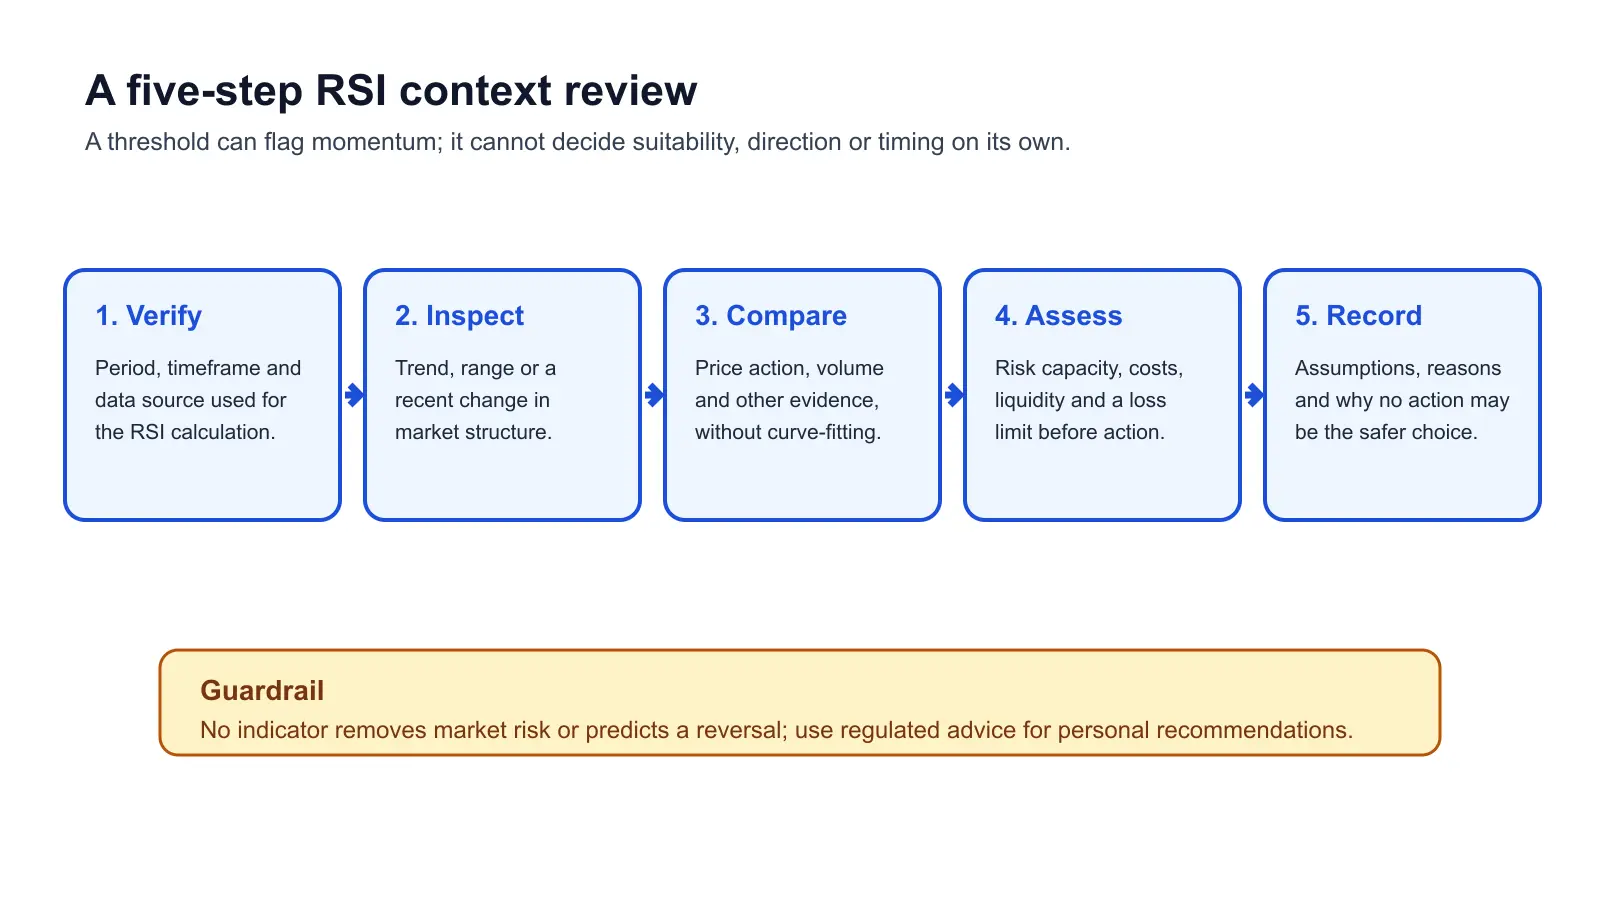
- Verify the RSI period, chart interval and data source.
- Inspect whether the price is trending, ranging or changing structure.
- Compare price action and other evidence without adding indicators merely to confirm a preferred view.
- Assess liquidity, costs, downside capacity and position-size limits before any action.
- Record assumptions and why no action may be safer when the evidence is unclear.
Common mistakes
- Treating “above 70” as an automatic sell instruction.
- Assuming a technical indicator removes market or execution risk.
- Ignoring the selected timeframe and data source.
- Using a single chart signal as a substitute for due diligence.
- Acting on social-media tips or claims of certain returns.
Investor checklist
- Can you state the timeframe and settings behind the RSI reading?
- Have you considered the broader price trend and relevant company information?
- Are costs, liquidity and risk capacity understood before acting?
- Have you avoided interpreting a momentum label as a prediction?
- Would independent, regulated advice be more appropriate for a personal decision?
For related learning, see Support and Resistance: How to Mark Zones Instead of Exact Prices, 200-Day Moving Average: Understanding the Long-Term Trend Filter, and Why Risk Management Beats Prediction.
Source Links
- SEBI Investor: Technical Analysis vs. Fundamental Analysis
- NSE: Technical Analysis and Chart Patterns material
- NISM: Reading the market’s language
- SEBI Investor: Due Diligence
Reviewed by Abhipra Research / Compliance Team.
Disclaimer
This article is for educational and informational purposes only. It is not investment or trading advice. Technical indicators do not guarantee returns or predict price movements. Investments in securities market are subject to market risks. Please read all related documents carefully and consult a qualified advisor before making a financial decision.