
ROE: Measuring Return on Shareholders’ Capital Without Reading It in Isolation
Return on equity (ROE) is often quoted as a quick signal of business quality. It is more useful when treated as a question: how much profit did a company generate relative to the shareholders’ capital employed, and what changed underneath that result?

Start with the numerator and denominator
In its financial-ratios explainer, the National Institute of Securities Markets (NISM) describes ROE as net income divided by shareholders’ equity. A common analytical presentation is:
ROE = Profit after tax ÷ average shareholders’ equity × 100
Using average equity can be more informative when equity changed materially during the year. The exact presentation should be checked against the company’s annual report and the ratio definition it uses. A high or rising ROE is not, by itself, evidence that a share is suitable to buy; it is one input for understanding profitability relative to the equity base.
Where to find the inputs in an annual report
Begin with the profit after tax in the statement of profit and loss. Then review shareholders’ equity in the balance sheet, including the opening and closing balances, changes in share capital, retained earnings, other equity and any material adjustments. NISM’s financial-statement guidance is clear that the income statement, balance sheet and cash-flow statement should be examined together, rather than treating one ratio as a complete verdict. Read NISM’s financial-statement analysis overview.

Why the same ROE can mean different things
ROE may be shaped by profit margin, how efficiently assets are used and the degree of financial leverage. For that reason, compare a company with its own prior years and with businesses that have a similar model and capital intensity. A bank, an asset-light services company and a capital-intensive manufacturer can have very different balance-sheet structures; comparing headline ROE across unlike models can mislead.
Look beyond the result when there is a large change in equity, a one-off gain or loss, a revaluation item, a major acquisition, a buyback or unusually high debt. SEBI’s ICDR regulations illustrate why definitions matter in formal disclosures: the cited return-on-net-worth provision specifies exclusions for revaluation reserves and extraordinary items. See the relevant SEBI ICDR regulation text.
An illustrative denominator effect: axes and inference
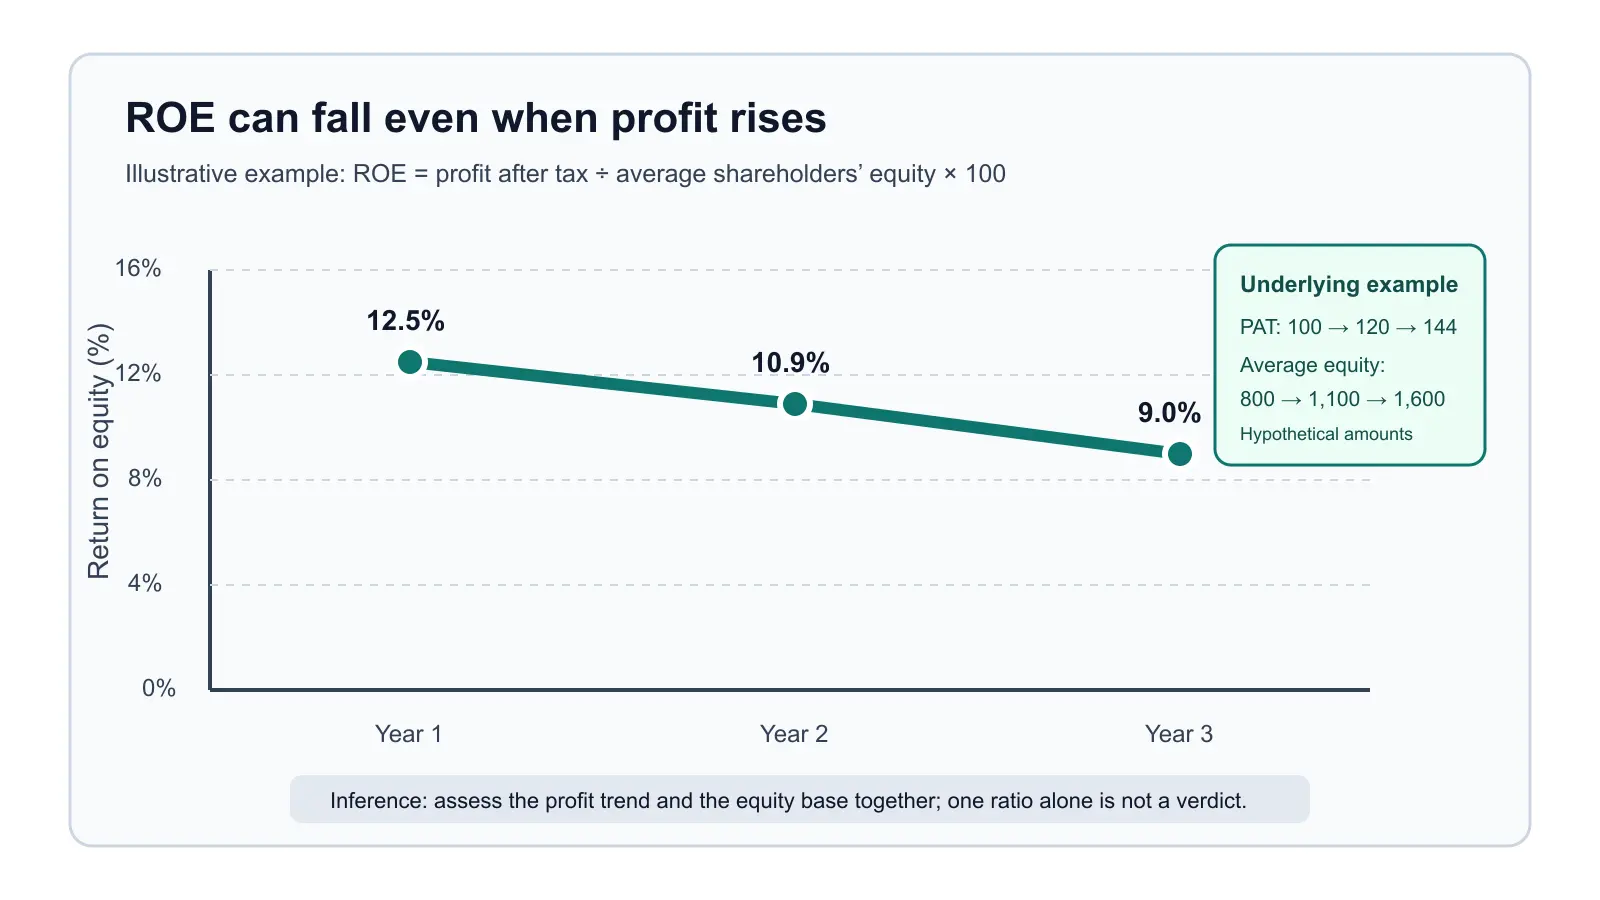
The horizontal axis is financial year and the vertical axis is ROE percentage. The figures—profit after tax of 100, 120 and 144; average equity of 800, 1,100 and 1,600—are hypothetical units, not company or market data. The chart shows ROE moving from 12.5% to 10.9% to 9.0% because the equity base grows faster than profit. The inference is limited: a falling ratio calls for explanation, not an automatic conclusion about the business or its securities.
| Check | Why it matters |
|---|---|
| Profit quality | Separate recurring operating performance from one-off gains, losses or accounting adjustments. |
| Equity changes | New capital, retained earnings, buybacks and other equity movements can change the denominator. |
| Leverage and cash flow | A ratio can look stronger while debt risk rises or cash conversion weakens; read the balance sheet and cash-flow statement too. |
| Comparable context | Compare several years and a genuinely comparable peer set, while allowing for sector and business-model differences. |
A controlled review workflow
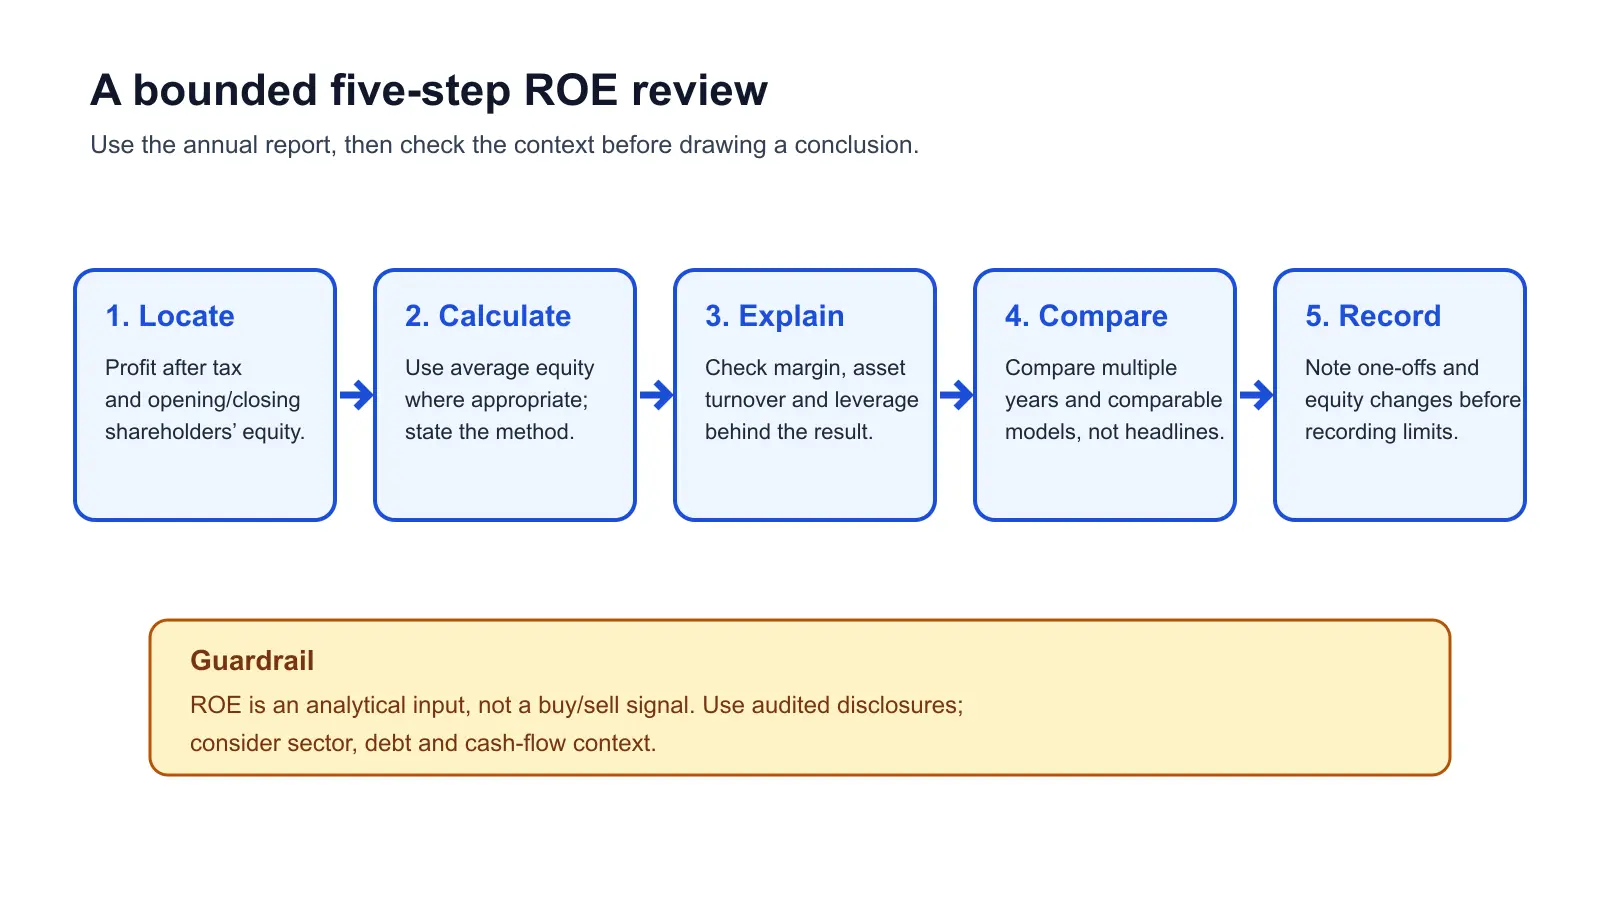
- Locate profit after tax and opening and closing shareholders’ equity in the annual report.
- State whether the calculation uses closing or average equity, and apply that method consistently.
- Explain what changed in margins, asset use, capital structure and material one-offs.
- Compare more than one reporting period and only comparable business models.
- Record limitations and cross-check debt, interest coverage, cash flow and relevant disclosures.
Common mistakes
- Comparing a lender, a manufacturer and an asset-light business solely by one ROE number.
- Treating a high ROE as proof of a low-risk investment.
- Ignoring a shrinking equity base, a buyback or additional leverage that may affect the ratio.
- Using an unaudited headline without reading the notes and cash-flow statement.
- Assuming an accounting ratio predicts future returns or share-price movement.
Investor checklist
- Is the ratio definition and reporting period clear?
- Have you read the profit, equity and cash-flow disclosures together?
- Are large one-offs, equity movements or debt changes explained?
- Is the comparison over several years and against comparable models?
- Have you avoided using ROE as a stand-alone buy, sell or timing signal?
For related learning, see How to Read a Company Before Buying Shares, Fundamental Analysis for Beginners, and Price-to-Book Ratio: When Book Value Is Useful and When It Is Not.
Source Links
- NISM: Financial Ratios
- NISM: Financial Statement Analysis
- SEBI Investor: Technical Analysis vs. Fundamental Analysis
- SEBI: ICDR Regulations
Reviewed by Abhipra Research / Compliance Team.
Disclaimer
This article is for educational and informational purposes only. It should not be considered investment advice, trading advice, tax advice or insurance advice. Investments in securities market are subject to market risks. Please read all related documents carefully before investing. Past performance is not indicative of future returns. Please consult a qualified financial advisor, tax advisor or insurance advisor before making any financial decision.