
Bull Put Spread: A Credit Strategy With Defined Downside, Not Defined Safety
A bull put spread is often described as a limited-risk, limited-reward options structure. That describes the payoff shape at expiry under stated assumptions; it does not make the strategy low risk, suitable for every investor, or easy to exit.

The two puts behind the structure
A bull put spread combines a short put at a higher strike with a long put at a lower strike, on the same underlying and expiry. The short put creates an obligation; the purchased lower-strike put is intended to cap the downside below that lower strike. NISM’s Equity Derivatives FAQ describes it as a limited-risk, limited-reward strategy for a neutral-to-moderately-bullish view. Read the NISM Equity Derivatives FAQ.
The premium received for the short put minus the premium paid for the long put is the net credit before charges. The strike difference, less that credit, sets the maximum expiry loss per unit in a simple illustration. Contract lot size, charges, margin, bid-ask spreads, taxes and the ability to close the position all affect actual cash requirements and realised results.

A defined payoff still has several moving parts
The term “defined downside” is narrow. It assumes the position is held and behaves as modelled to expiry, with both legs available and contract specifications understood. Before expiry, option value may move because of the underlying price, implied volatility, time decay, interest rates and liquidity. A wide bid-ask spread or difficulty exiting either leg can make a practical result differ from a textbook payoff diagram.
SEBI’s investor education material highlights market, liquidity and operational risks in derivatives, and warns that a relatively small initial outlay can multiply outcomes. See SEBI Investor’s derivatives overview.
An illustrative payoff chart: axes and inference
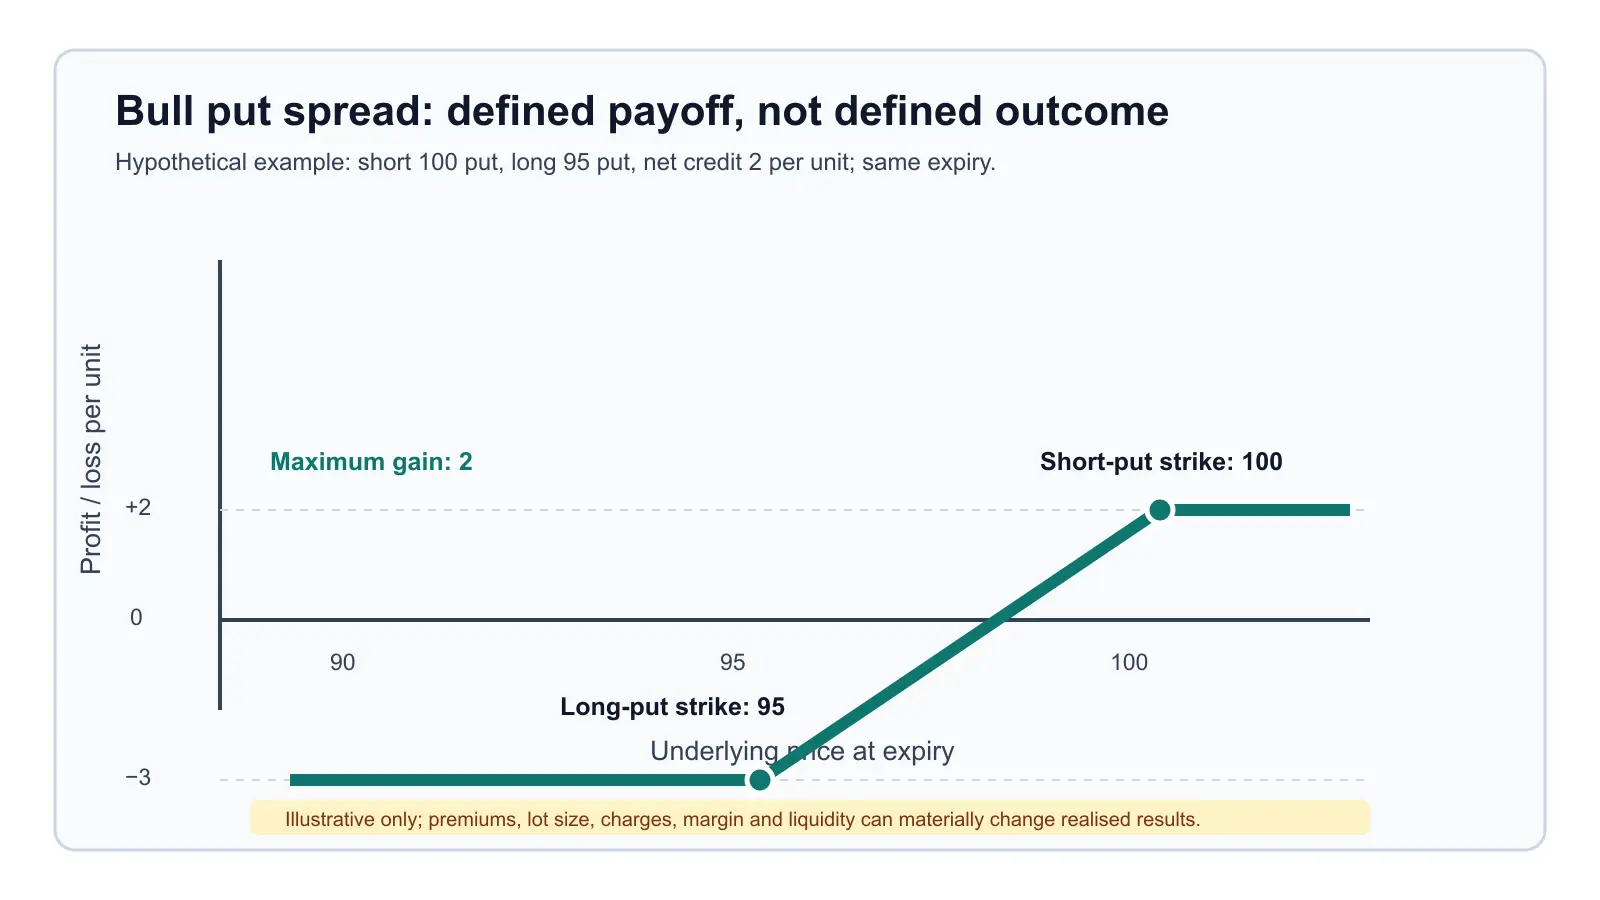
The horizontal axis is the underlying price at expiry; the vertical axis is hypothetical profit or loss per unit. In this illustration, selling the 100 put and buying the 95 put produces a net credit of 2. At or above 100, the maximum expiry gain is 2. At or below 95, the maximum expiry loss is 3. Between the strikes, the payoff changes with the expiry price. These are assumed figures, not current option quotes, expected returns or a recommendation.
Hypothetical expiry illustration
The following example uses the same assumed 100 short put, 95 long put and net credit of 2 per unit. It shows expiry payoff before brokerage, taxes, fees, margin effects and any early-exit value. A real contract’s lot size would multiply these per-unit figures.
| Underlying at expiry | Short 100 put | Long 95 put | Net credit | Strategy gain / loss |
|---|---|---|---|---|
| 105 | 0 | 0 | +2 | +2 maximum gain |
| 100 | 0 | 0 | +2 | +2 maximum gain |
| 99 | -1 | 0 | +2 | +1 gain |
| 98 | -2 | 0 | +2 | 0 breakeven |
| 97 | -3 | 0 | +2 | -1 loss |
| 95 | -5 | 0 | +2 | -3 maximum loss |
| 93 | -7 | +2 | +2 | -3 maximum loss |
| It can show | It cannot establish |
|---|---|
| The assumed expiry gain/loss range, strike gap and breakeven logic. | Whether the position will be profitable, liquid, affordable or suitable for a particular investor. |
| Why the long put limits the expiry loss below its strike in the stated example. | Actual execution quality, margin changes, transaction costs, tax treatment or early-exit value. |
Risk evidence belongs before strategy language
SEBI’s August 2026 study reports that 87.7% of individual traders in the equity derivatives segment incurred losses in FY26, and that options accounted for 92% of aggregate individual losses. This is population-level evidence, not a forecast for any position, but it is a reason to place capital preservation, affordability and process ahead of a strategy label. Read SEBI’s FY25–FY26 derivatives profitability study.
A controlled pre-trade workflow
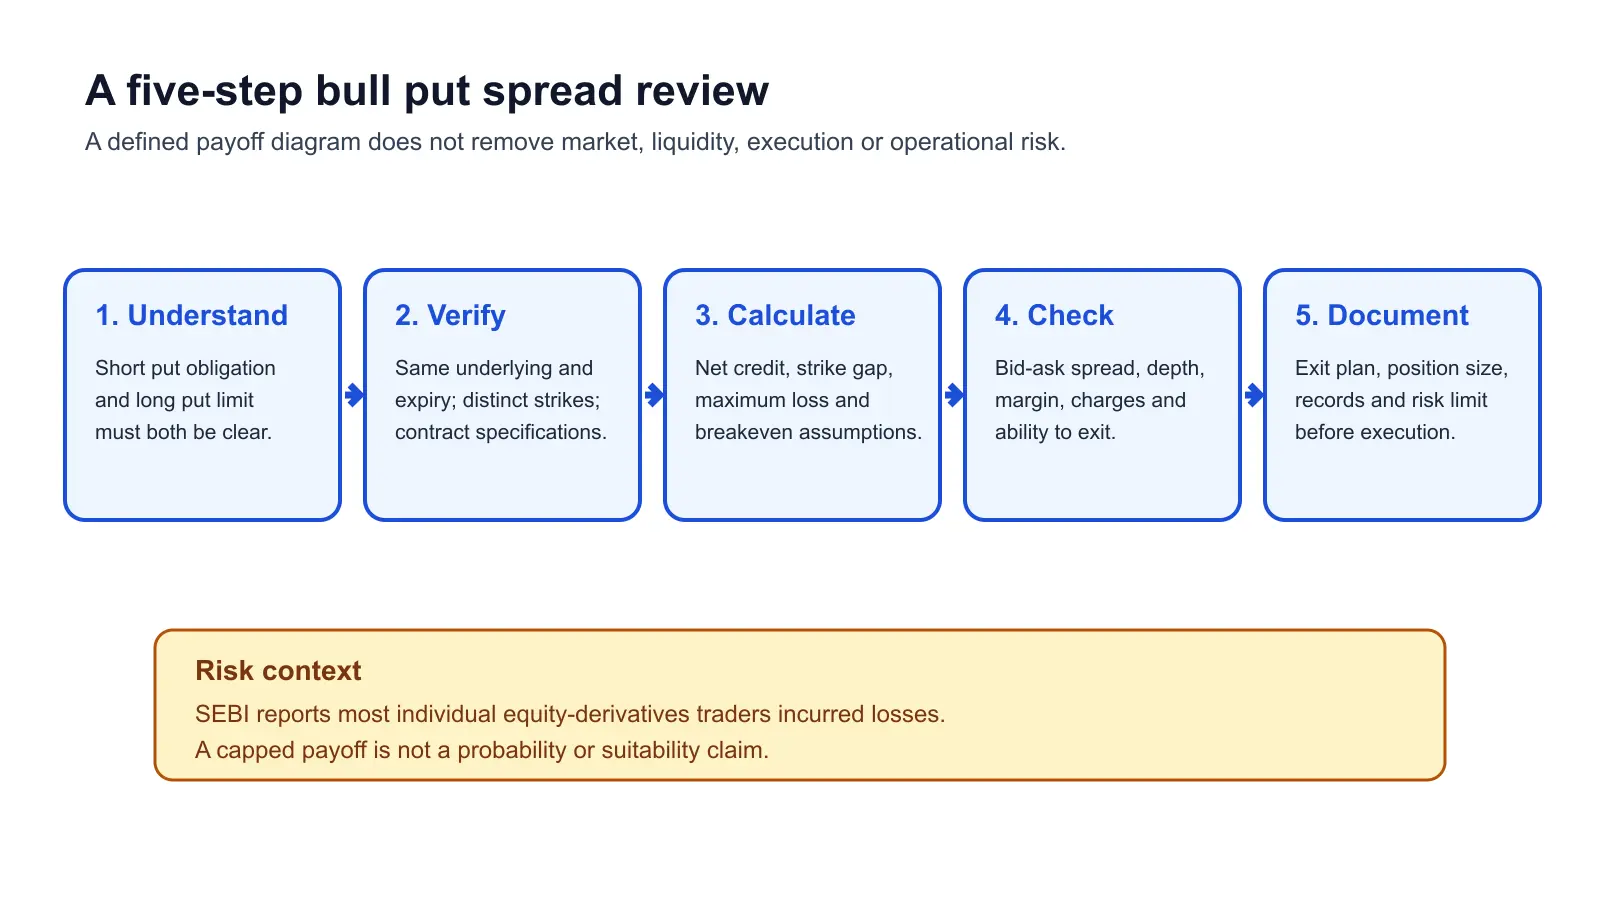
- Understand the short-put obligation and the protective purpose of the long put.
- Verify the underlying, expiry, strike order, lot size and contract specifications.
- Calculate the net credit, strike gap, maximum loss and breakeven from stated assumptions.
- Check bid-ask spreads, market depth, margin, charges and whether both legs can be exited responsibly.
- Document position-size limits, an exit process and records before any execution decision.
Common mistakes
- Calling a limited-loss diagram a low-risk or high-probability outcome.
- Ignoring lot size, available margin, charges and bid-ask spreads.
- Treating the premium received as income without analysing the obligation assumed.
- Reviewing only the short put and not the combined two-leg position.
- Entering close to expiry without understanding time, volatility and liquidity risk.
Investor checklist
- Can you explain the obligation on the short put in your own words?
- Have you calculated the maximum loss for the actual lot size and added transaction costs?
- Are the strikes, expiry and contract specifications verified from the exchange/broker platform?
- Is liquidity adequate for both legs under stressed conditions?
- Have you concluded that not trading may be more appropriate if the risks, controls or affordability are unclear?
For related learning, see Futures and Options Explained for Beginners, Margin Calls Explained, and Why Risk Management Beats Prediction.
Source Links
- NISM: Equity Derivatives FAQ
- SEBI: FY25–FY26 Equity Derivatives profitability study
- SEBI Investor: Understanding Derivatives
Reviewed by Abhipra Research / Compliance Team.
Disclaimer
This article is for educational and informational purposes only. It should not be considered investment or trading advice. Derivatives involve substantial risk and may not be suitable for all investors. Investments in securities market are subject to market risks. Please read all related documents carefully before investing or trading and consult a qualified advisor before making a financial decision.