
What the Latest NPS Numbers Show — and What They Do Not
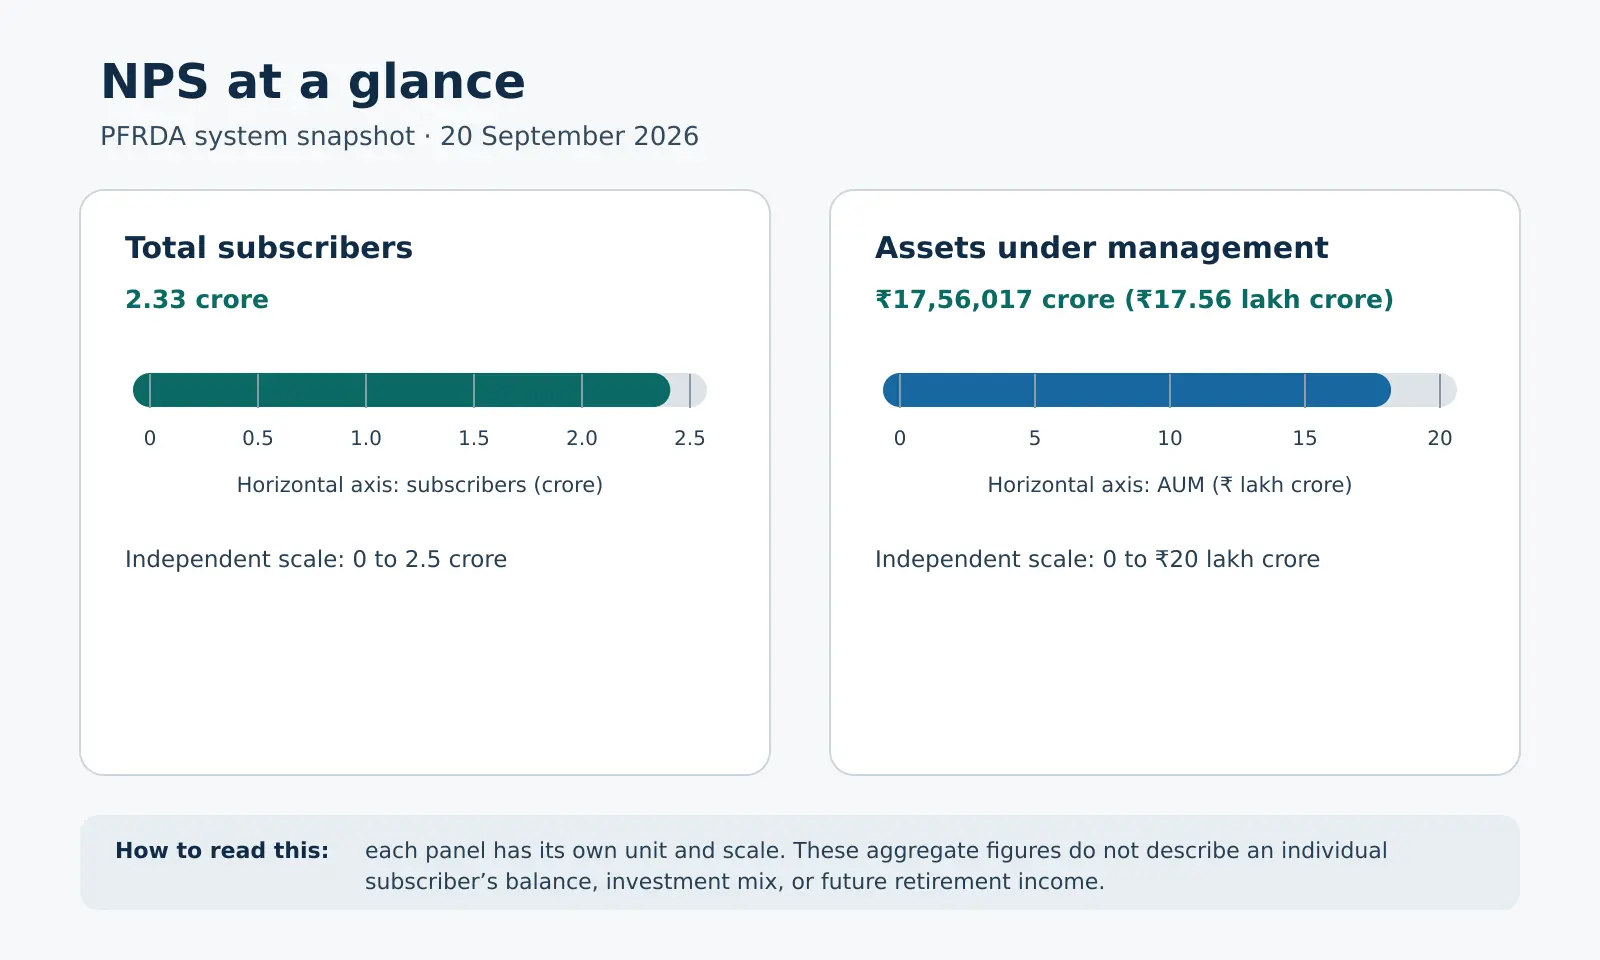
A system can grow to a large scale while every subscriber’s account remains personal. PFRDA’s latest published NPS snapshot shows 2.33 crore subscribers and ₹17,56,017 crore in assets under management (AUM), with both figures dated 20 September 2026.

Reading the two measures
The left panel measures total subscribers in crores on a scale from 0 to 2.5 crore. The right panel measures AUM in lakh crore rupees on a separate scale from 0 to ₹20 lakh crore. Each bar starts at zero; its endpoint marks the PFRDA headline value for that measure.
The chart shows the scale of NPS as a system. Its inference is limited: the subscriber count and AUM are aggregate totals, not the average or typical account balance, and they do not show one person’s investment mix, contribution history or retirement income. The panels use different units and scales, so their bar lengths should not be compared with each other.
What subscribers can use instead
For a personal view, check your own NPS statement for contributions, units, NAV and current asset allocation. If you are reviewing pension fund or investment choices, compare the options available to your account and consider your time horizon and risk comfort. A sector-wide total cannot answer whether a particular option is suitable for you.
NPS is a defined-contribution, market-linked retirement system. The eventual corpus depends on contributions, investment choices and market performance; a large system AUM figure is not a return promise or a forecast.
For support with NPS services, see Abhipra’s NPS & Pension services. Abhipra has acted as a Point of Presence for 17 years.
Frequently asked questions
Does ₹17.56 lakh crore mean each subscriber has a similar-sized corpus?
No. AUM is the total value of assets across the system. Account balances vary with contributions, tenure, investment choices and market movements.
Do more subscribers automatically mean higher returns?
No. Subscriber count measures participation, while returns depend on the subscriber’s investments and market performance. Participation growth does not predict future returns.
How current are these figures?
PFRDA labels the NPS subscriber and AUM snapshot as data as of 20 September 2026. Check PFRDA’s statistics pages for later updates and sector-level detail.
Put headline scale in context
The figures show a large and expanding retirement-savings system, but not an individual forecast. Use system statistics to understand scale; use your own account records and current official rules to make personal decisions.
This article is for investor education and is not investment, tax or legal advice. NPS is market-linked and returns are not guaranteed. Verify current scheme features with PFRDA, your CRA or the relevant NPS intermediary before acting.