
200-Day Moving Average: Understanding the Long-Term Trend Filter
A 200-day moving average is often drawn as a single smooth line beneath or above a share-price chart. It can be useful for reducing daily noise, but it cannot tell an investor what will happen next. Treat it as a review tool, not a buy or sell instruction.

What the 200-day moving average actually measures
For each trading day, a simple 200-day moving average adds the closing prices for the latest 200 trading sessions and divides the total by 200. When the next day is added, the oldest observation drops out. This rolling calculation is why the line is smoother—and slower—than the daily price.

SEBI’s investor education material lists moving averages, including 50-day and 200-day versions, as technical tools that can help identify trend direction. It also distinguishes technical analysis from fundamental analysis, which reviews a company’s financial health, business model and economic context. Read SEBI’s technical-versus-fundamental analysis explainer.
What a long-term filter can and cannot tell you
An investor may observe whether the price is above or below a 200-day average, or whether the average itself is rising, falling or broadly flat. These are descriptions of historical price behaviour. They are not forecasts, valuation estimates or guarantees of a trend.
NSE’s technical-analysis learning material includes major indicators, oscillators, trading psychology and risk management in the same curriculum. That wider context matters: an indicator should not replace a decision about objectives, liquidity, diversification, costs or loss capacity. See the NSE technical-analysis module overview.
| Chart observation | What it may help an investor review | What it does not establish |
|---|---|---|
| Price is above a rising average | Whether recent price action has remained stronger than its long look-back trend. | That the price will rise, that the business is attractive, or that a purchase suits the investor. |
| Price is below a falling average | Whether the investor should slow down and revisit thesis, risk controls and position size. | That a decline must continue or that selling is automatically appropriate. |
| Price repeatedly crosses a flat average | Whether the long-term direction is unclear and the tool is producing little separation from noise. | A reliable turning point, entry point or exit point. |
Read the filter alongside the business and the risk
Before relying on any chart indicator, check the company’s disclosures, financial statements, corporate announcements, liquidity and the reason the security is being considered. SEBI’s due-diligence guidance specifically points investors to the business model, competitors, financial statements, economic conditions, historical data and corporate announcements. Use SEBI’s due-diligence checklist.
A 200-day average is also a lagging measure. It needs a full 200-session history and will react after prices have already moved. Corporate results, policy changes, sector developments, market-wide stress and thin trading can all change the relevance of a historical pattern.
The illustrative chart: axes and inference
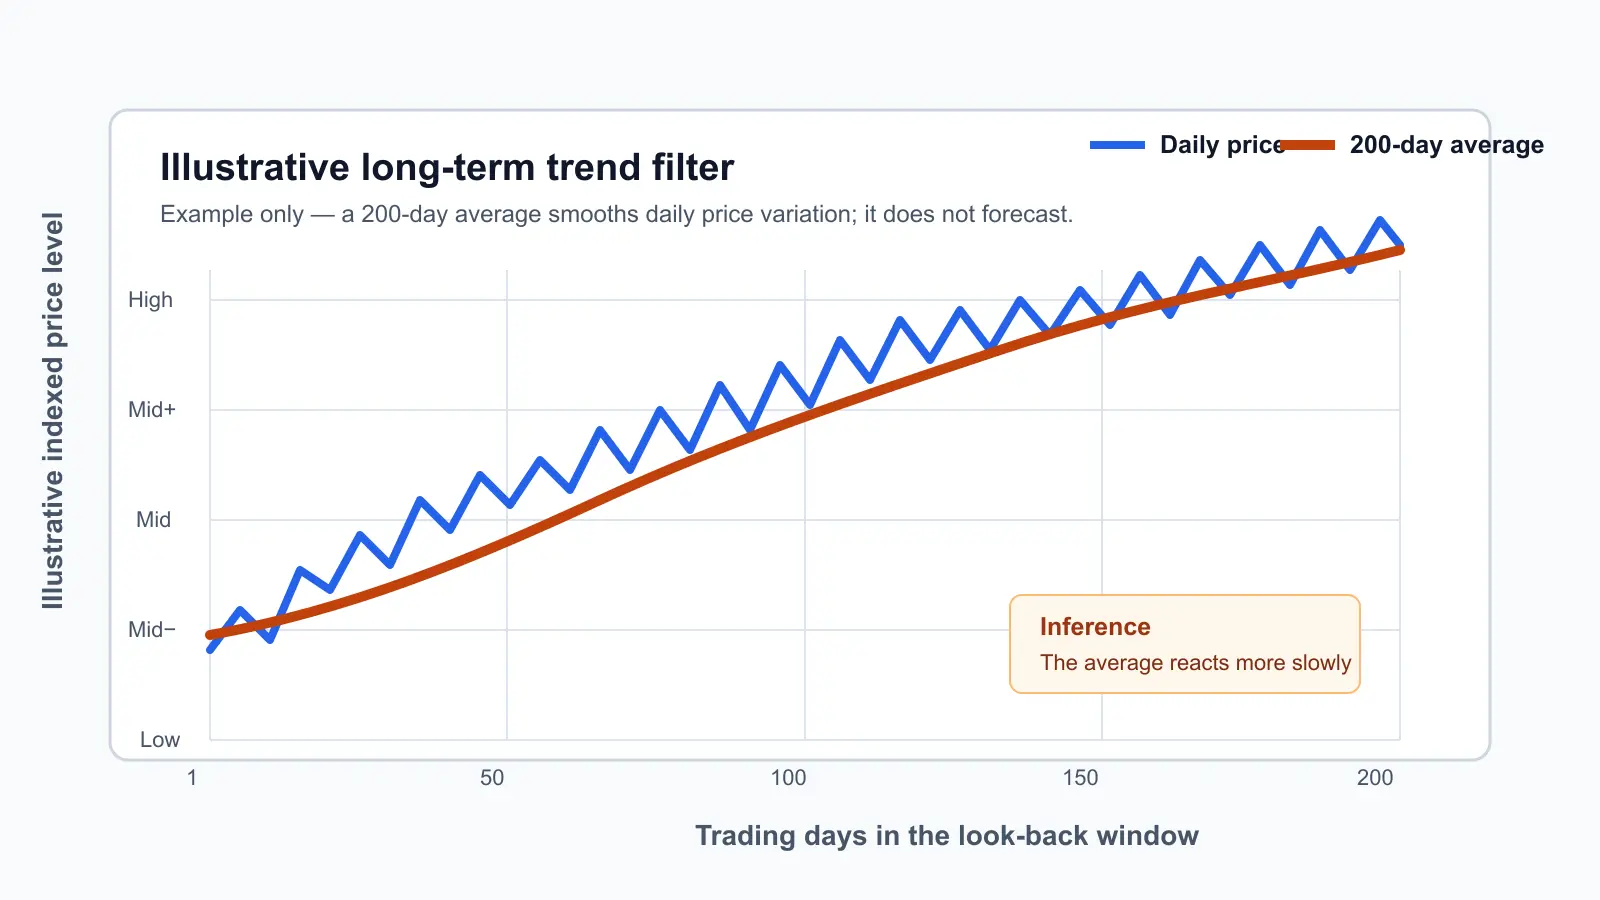
The horizontal axis covers trading days 1 to 200; the vertical axis is an illustrative indexed price level, not a real security price. The blue line varies daily while the orange 200-day average changes more gradually. The inference is limited: smoothing can make a longer historical direction easier to see, but the delay that creates the smooth line also prevents it from predicting the next move.
A five-step review routine
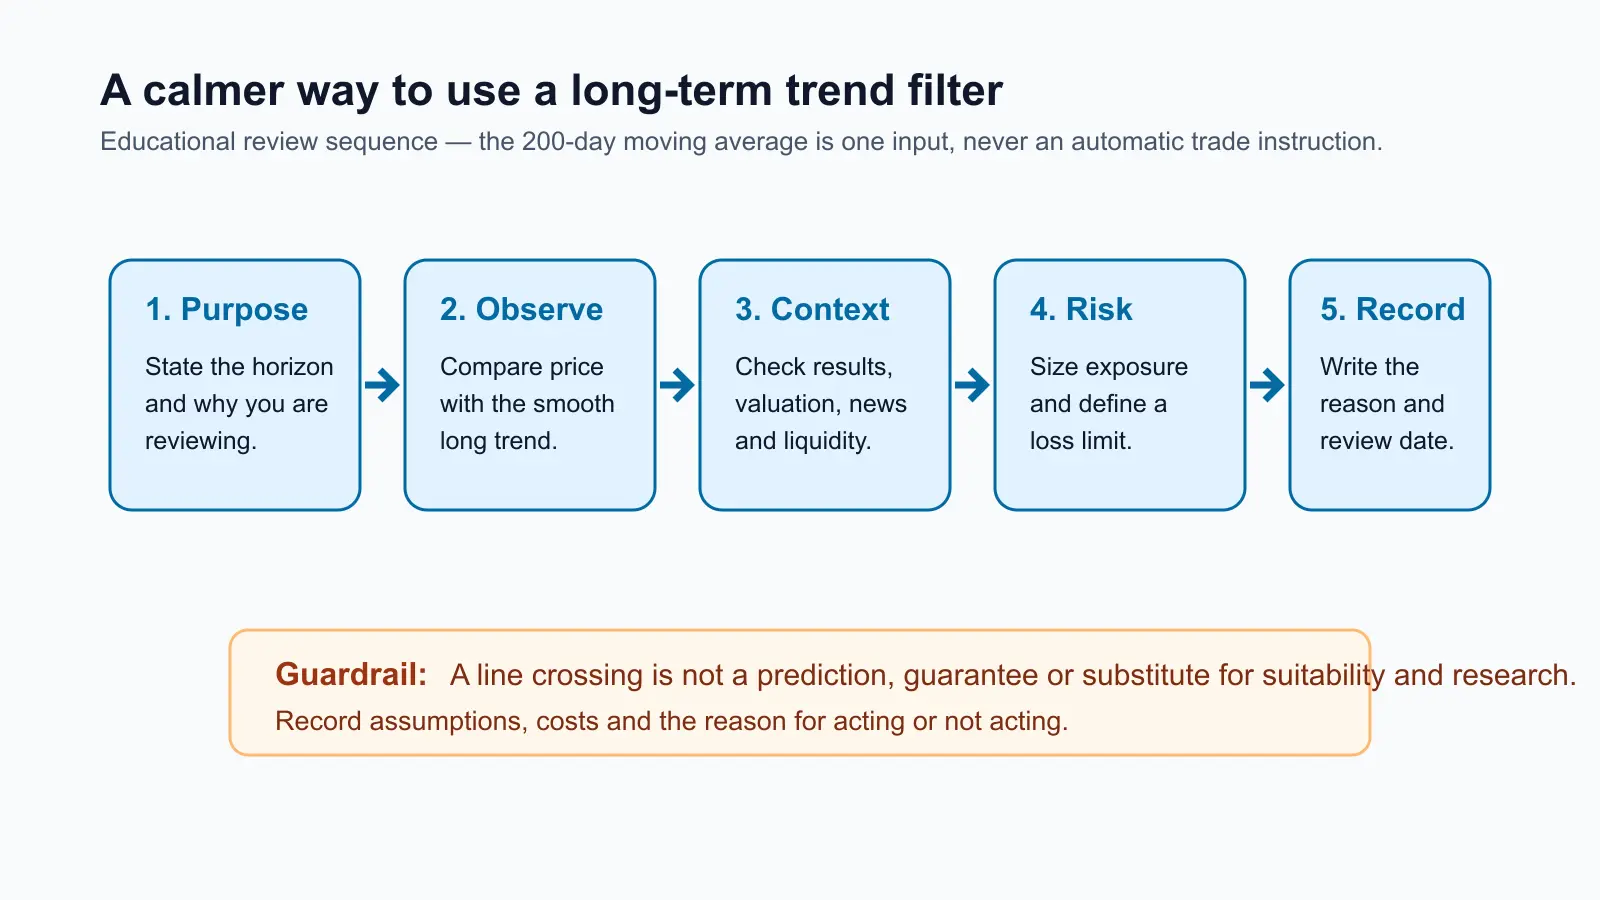
- Define the purpose and holding horizon before opening a chart.
- Observe the price and the 200-day average without treating a crossing as an instruction.
- Check fundamentals, disclosures, valuation context, news, liquidity and diversification.
- Set exposure and risk limits that your finances can absorb; include brokerage, statutory charges, taxes and slippage where relevant.
- Record why you acted—or chose not to act—and schedule the next review.
Common mistakes
- Assuming “above the line” means a security is inexpensive or suitable.
- Ignoring a company’s financial disclosures because the chart looks strong.
- Treating a delayed indicator as a precise entry or exit level.
- Trading frequently on every crossing without accounting for costs, taxes and liquidity.
- Taking a position too large for the investor’s risk capacity.
Investor checklist
- Is this a study of past price behaviour, or am I mistaking it for a forecast?
- Have I checked company disclosures and the reason for my investment thesis?
- Does the time horizon match the use of a long look-back indicator?
- Have I considered diversification, liquidity, transaction costs and tax implications?
- Can I explain the decision without relying on one chart line?
For related foundations, see Stock Market Basics for New Investors, How to Read a Company Before Buying Shares, and Support and Resistance: How to Mark Zones Instead of Exact Prices.
Source Links
- SEBI Investor: Technical Analysis vs. Fundamental Analysis
- SEBI Investor: Due Diligence
- NSE: Technical Analysis Module
- NISM: Technical Analysis for Beginners
Reviewed by Abhipra Research / Compliance Team.
Disclaimer
This article is for educational and informational purposes only. It should not be considered investment advice, trading advice, tax advice or insurance advice. Investments in securities market are subject to market risks. Please read all related documents carefully before investing. Past performance is not indicative of future returns. Please consult a qualified financial advisor, tax advisor or insurance advisor before making any financial decision.