Support and Resistance: How to Mark Zones Instead of Exact Prices
Reviewed on: 10 October 2026. Reviewed by Abhipra Research / Compliance Team.
Support and resistance are better treated as review areas than as exact prices. A prior turning area can help an investor organise observations, but it cannot predict the next move or replace risk management, research and suitability checks.

Why a zone is more realistic than a single line
Technical analysis studies price movements, patterns and trading volumes; NSE Academy includes support, resistance and support/resistance zones in its technical-analysis curriculum. In real trading, price can turn near an earlier area, briefly cross it, or ignore it. A narrow line can create false precision.
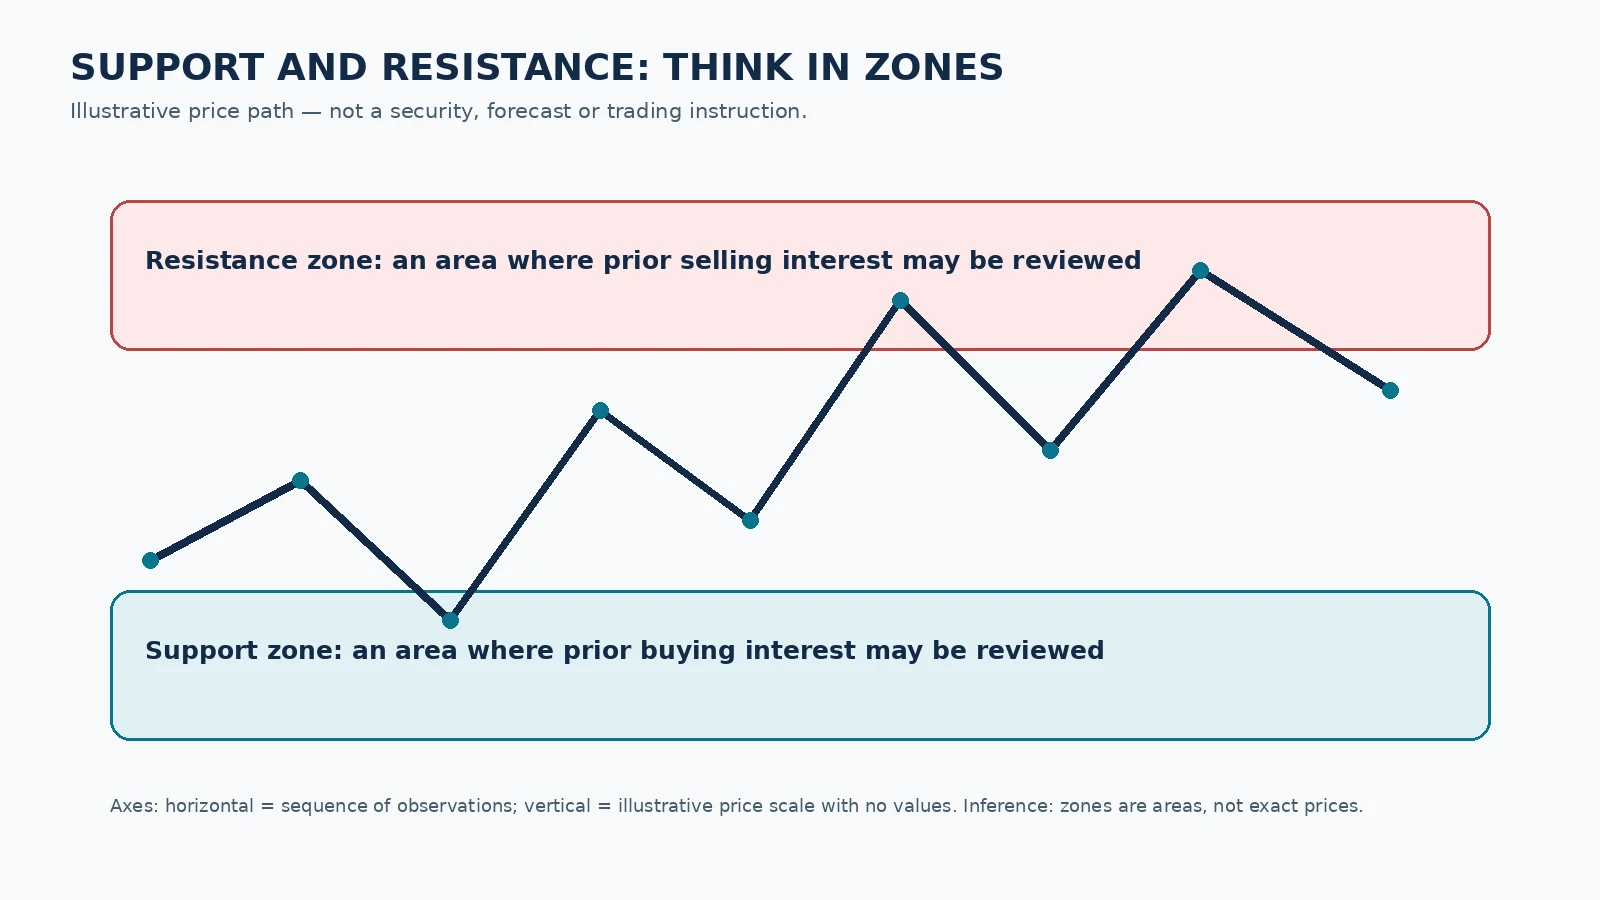
The horizontal axis is the sequence of observations. The vertical axis is an intentionally unnumbered illustrative price scale; it is not market data. The red and teal bands are broad review zones. The inference is limited: prior reaction areas may deserve context review, but neither band is a forecast or a buy/sell instruction.
How to mark a review area
- Start with several prior turning points rather than one candle high or low.
- Mark a band wide enough to reflect repeated reactions, gaps and normal price noise.
- Check the broader trend, volume and material company or market information.
- Decide risk limits and position sizing before acting; do not widen risk merely because a zone is nearby.
A five-step discipline around zones
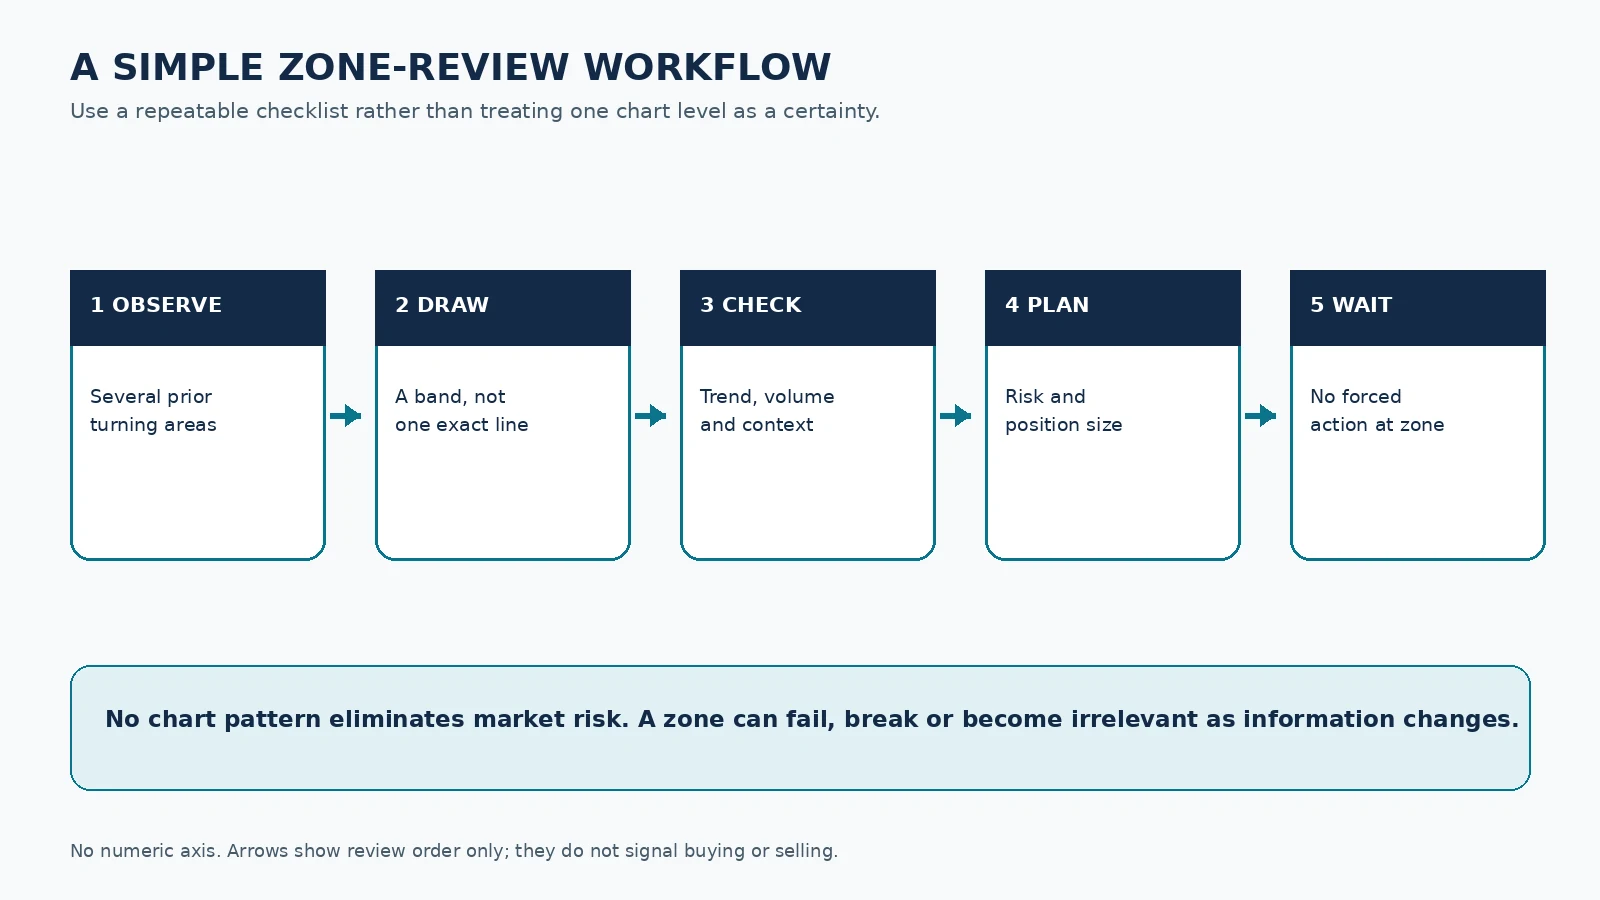
This workflow has no numeric axis. Each card is a decision-control step, not a trade signal. Its final point matters most: a level can fail, and waiting is often preferable to reacting to a single chart touch.
Common mistakes
- treating a prior high or low as a guaranteed turning point;
- drawing zones after the fact without a consistent method;
- ignoring liquidity, news, volatility and transaction costs; and
- taking a position solely from a social-media chart or unsolicited tip.
SEBI notes that securities-market investing carries risk and that past performance does not guarantee future outcomes. Technical analysis can be one input, not a substitute for independent research, risk appetite and an appropriately regulated adviser where advice is needed.
Source links
- NSE Technical Analysis Module — course outline includes support, resistance and zones.
- SEBI Investor: Technical and Fundamental Analysis.
- SEBI Investor: factors to consider before investing.
Disclaimer
This article is for general educational information, not investment advice or a recommendation to buy, sell or hold any security. Technical analysis is uncertain; losses can occur. Evaluate your objectives, risk tolerance, costs and suitability before investing or trading.