Mid-Cap Mutual Funds Compared: Six Evidence Profiles in June 2026
Mid-cap funds are often chosen for growth potential, but the category can test an investor’s patience when valuations, liquidity and market leadership change.
A comparison of 33 mid-cap schemes as of 21 June 2026 reveals a more useful question than “Which fund has the highest return?” The better question is: which combination of consistency, volatility, cost, scale and portfolio structure fits the role this allocation must perform?

How the Comparison Was Narrowed
The review separated schemes that could not be compared on equal terms. The ranked group contains active mid-cap growth schemes with observed 3-year and 5-year return histories. Eight newer schemes without both observed periods were not scored, and no missing number was estimated.
The shortlist uses regular growth plan data. Direct-plan expenses and returns will differ.
The dated comparison lists Nifty Midcap 150 TRI as the benchmark for the six selected rows. Current AMC documents must still be checked because benchmarks can change or differ across disclosures.
Twenty-five eligible schemes were assessed using:
- 3-year, 5-year and 10-year annualised returns;
- alpha, beta and standard deviation;
- Sharpe and Sortino ratios;
- expense ratio;
- assets under management; and
- portfolio market-cap structure.
The six schemes below had the strongest combined evidence under that method. This is an editorial comparison, not a recommendation or rating.
| Scheme | Observed annualised returns | Risk evidence | Cost and scale | Evidence profile |
|---|---|---|---|---|
| Nippon India Growth Mid Cap Fund | 3Y 22.83% 5Y 21.12% 10Y 18.79% |
Alpha 2.51 Beta 0.97 Standard deviation 18.10 Sharpe 0.95 |
Expense 1.25% AUM ₹47,415 crore |
Strong 5-year evidence, long history and large scale, with moderate historical variability for this shortlist. |
| HDFC Mid Cap Fund | 3Y 20.26% 5Y 20.33% 10Y 17.97% |
Alpha 2.49 Beta 0.85 Standard deviation 15.92 Sharpe 0.96 |
Expense 1.10% AUM ₹97,350 crore |
The lowest volatility, beta and cost in this group, combined with the largest asset base. |
| Edelweiss Mid Cap Fund | 3Y 22.31% 5Y 19.58% 10Y 18.62% |
Alpha 2.73 Beta 0.94 Standard deviation 17.76 Sharpe 0.96 |
Expense 1.43% AUM ₹16,849 crore |
A balanced profile across return periods, below-one beta and risk-adjusted measures. |
| Invesco India Midcap Fund | 3Y 24.76% 5Y 20.85% 10Y 18.84% |
Alpha 2.58 Beta 1.01 Standard deviation 19.43 Sharpe 0.92 |
Expense 1.47% AUM ₹12,397 crore |
Strong multi-period returns, balanced against above-average variability and slightly above-one beta. |
| HSBC Midcap Fund | 3Y 26.61% 5Y 19.60% 10Y 17.79% |
Alpha 4.73 Beta 1.03 Standard deviation 19.96 Sharpe 1.02 |
Expense 1.46% AUM ₹14,249 crore |
The strongest 3-year return and alpha here, accompanied by the highest variability and beta in the group. |
| ICICI Prudential Midcap Fund | 3Y 24.60% 5Y 19.24% 10Y 17.41% |
Alpha 4.02 Beta 0.99 Standard deviation 18.65 Sharpe 1.02 |
Expense 1.53% AUM ₹7,789 crore |
High alpha and risk-adjusted evidence with near-market beta, offset by the highest dated expense ratio and smallest scale here. |
On a narrow screen, the central comparison is:
- Nippon India leads the selected group over five years.
- Invesco India has the highest observed 10-year return.
- HSBC leads over three years and on alpha, but also shows the highest variability.
- HDFC has the lowest standard deviation, beta and expense ratio, plus the largest AUM.
- Edelweiss occupies a balanced middle ground across return and risk evidence.
- ICICI Prudential combines high alpha and Sharpe with a smaller asset base and higher dated cost.
Three Return Periods Produce Three Leaders
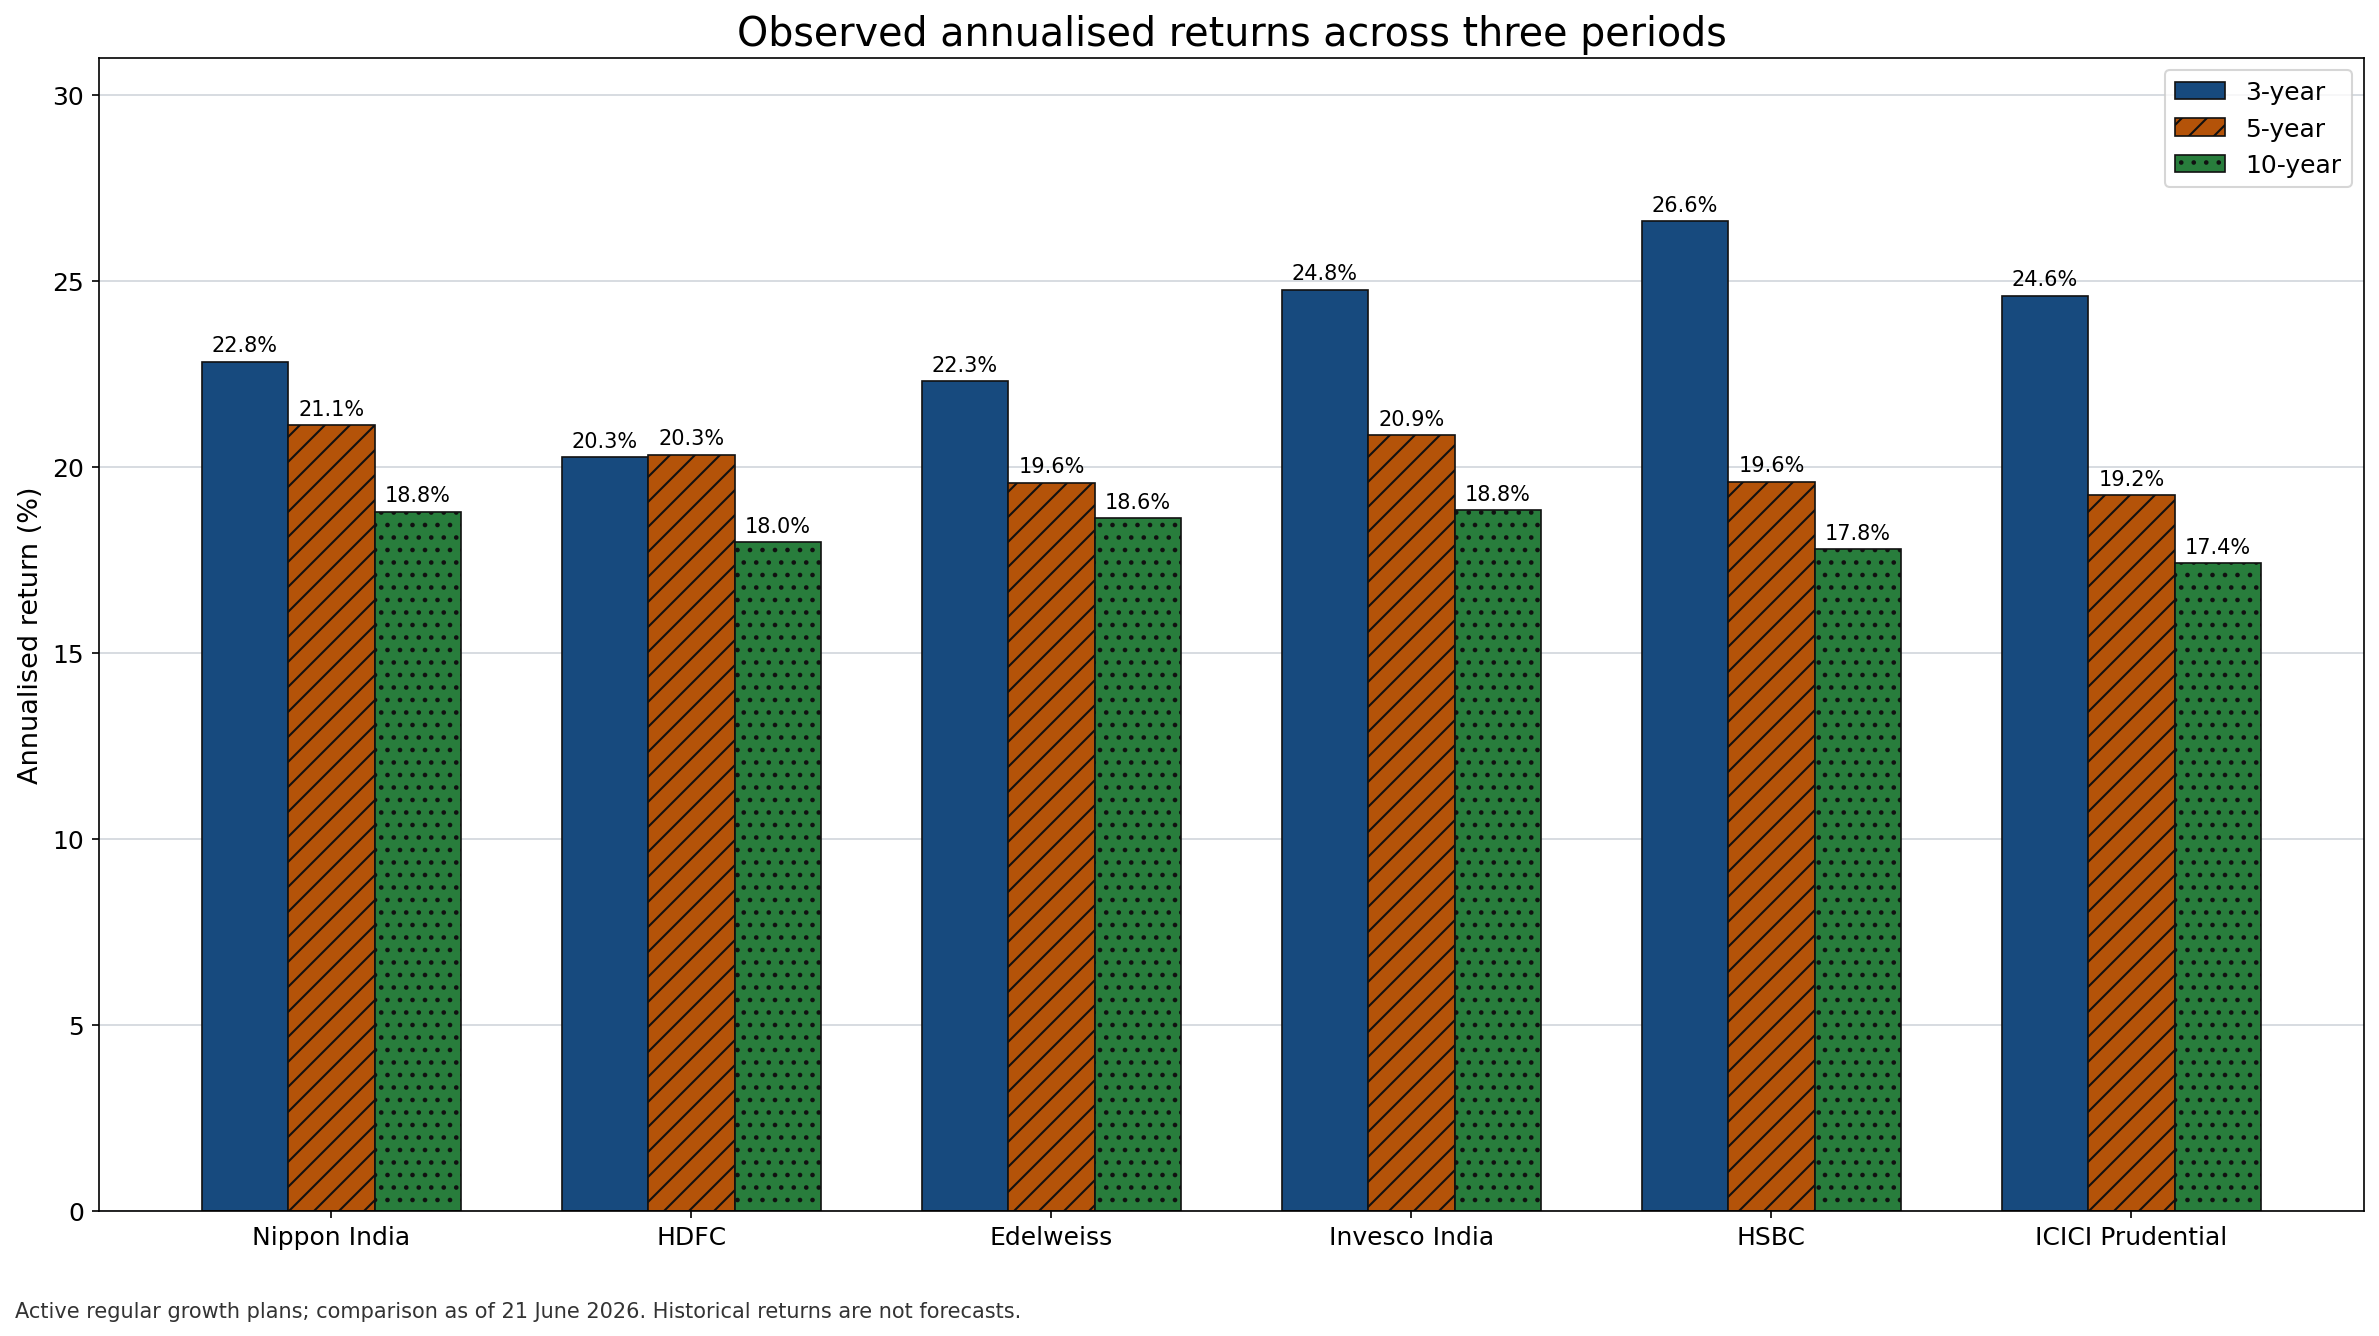
The chart prevents one recent number from controlling the decision.
HSBC Midcap Fund has the highest 3-year return at 26.61%. Its 5-year and 10-year figures do not lead the group, showing why recent strength should not be treated as a complete cycle.
Nippon India Growth Mid Cap Fund leads over five years at 21.12%, while Invesco India Midcap Fund narrowly leads over ten years at 18.84%.
The six 10-year returns sit in a relatively tight range compared with the 3-year figures. That convergence is a reminder that rankings can change materially depending on the period selected.
The Risk Evidence Changes the Order
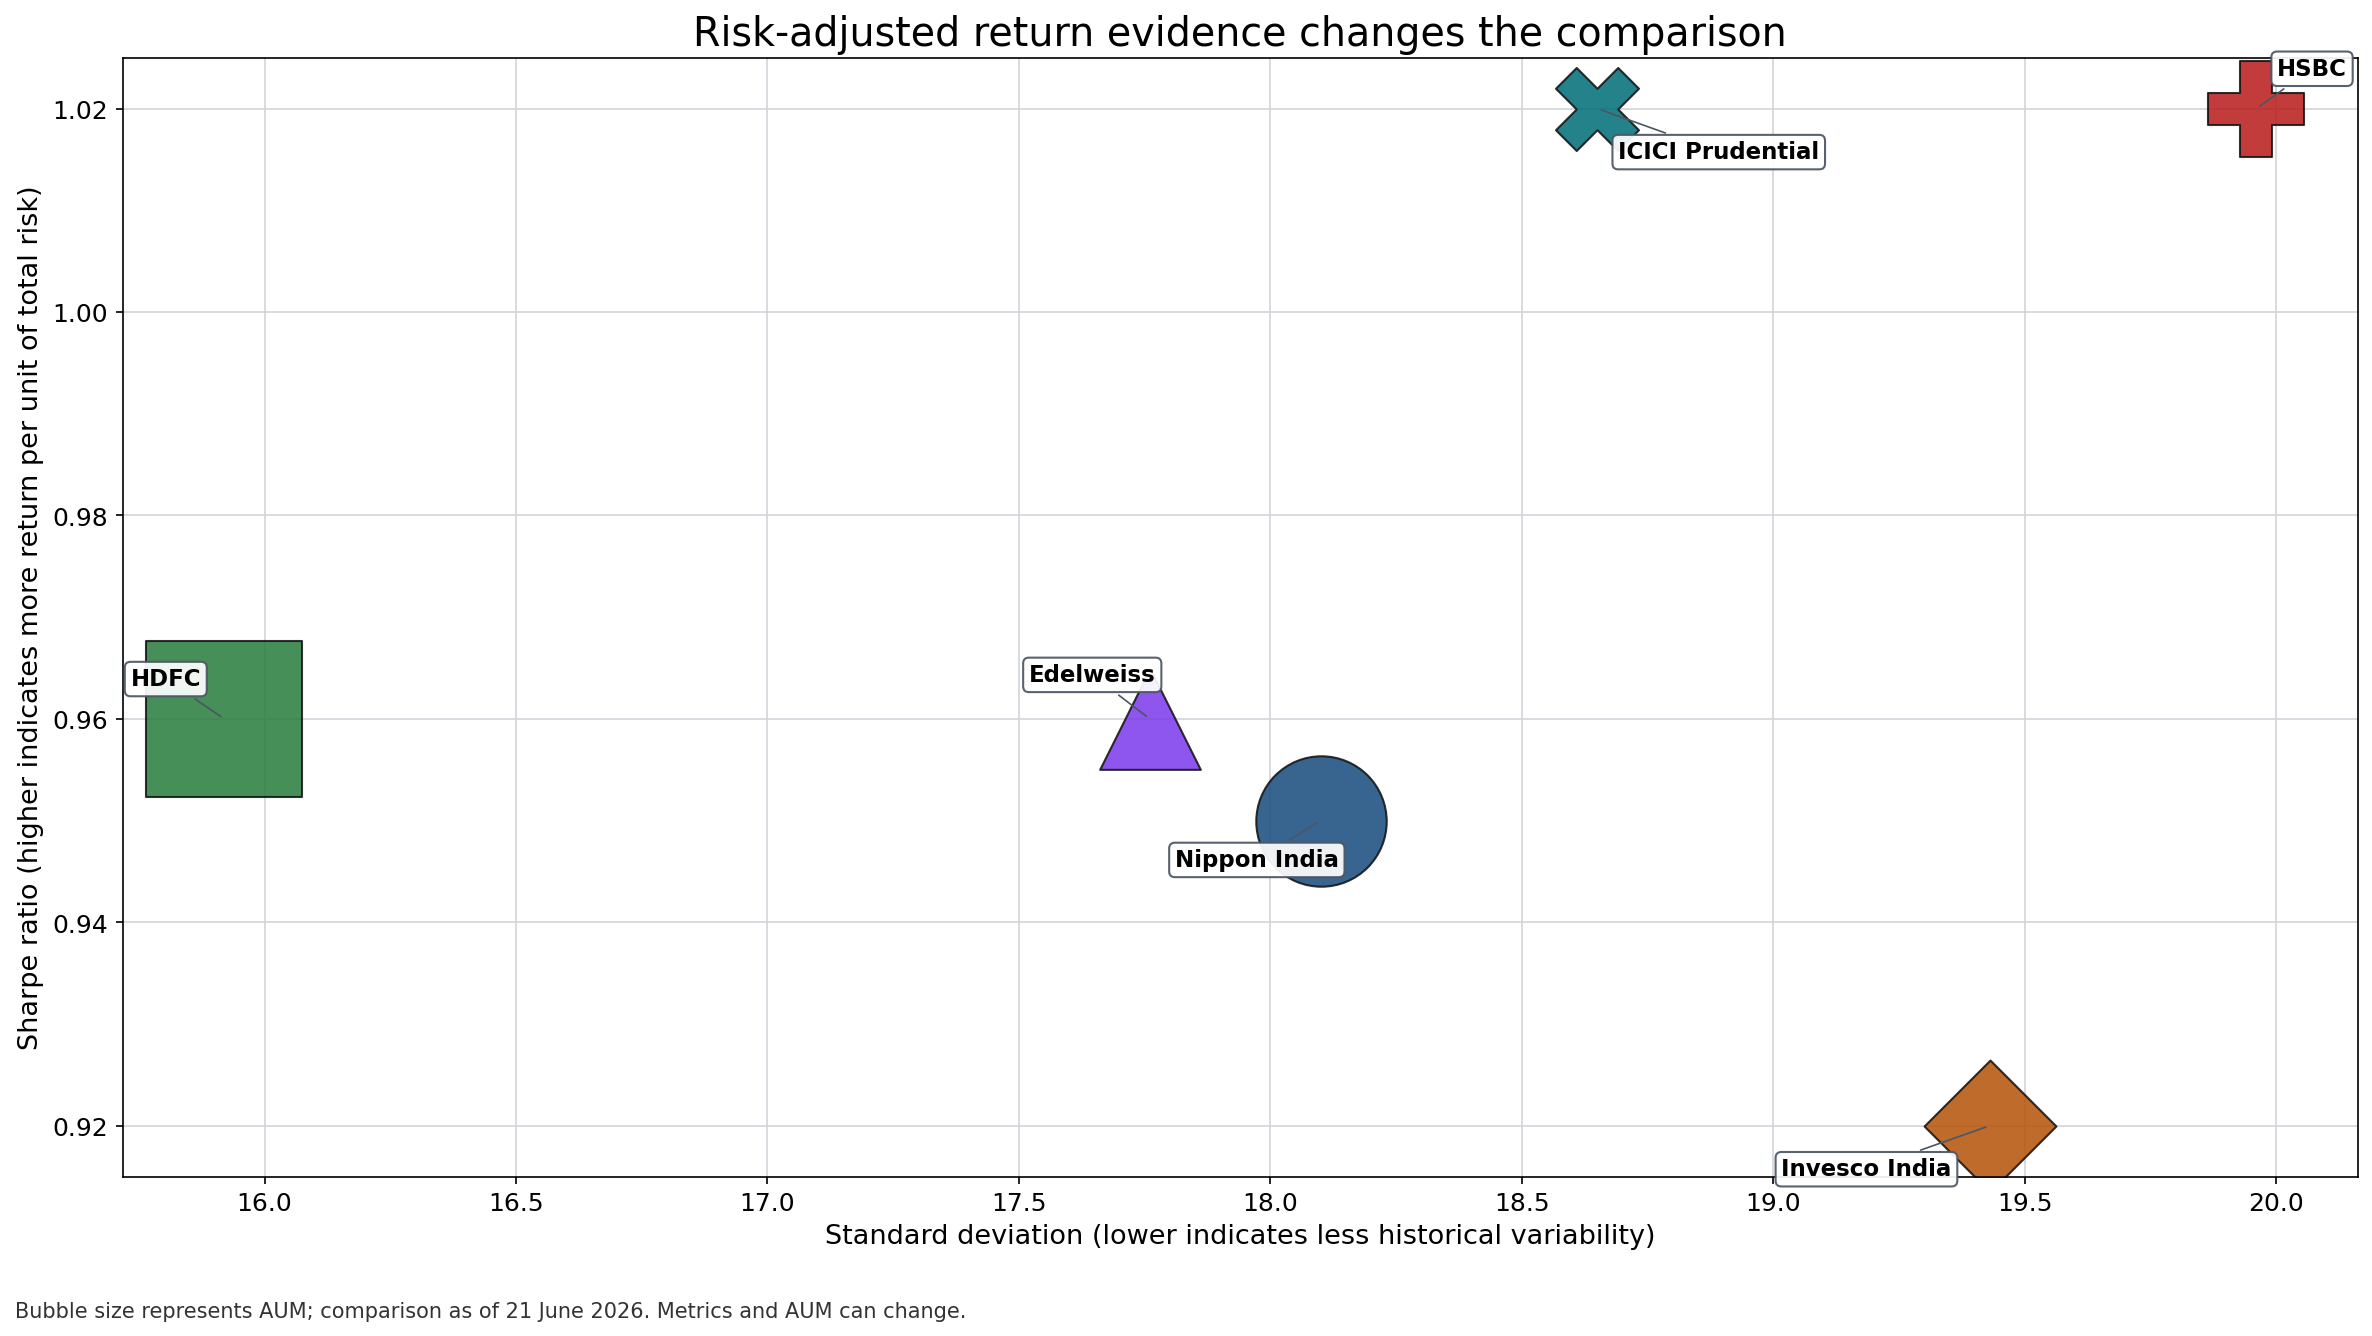
HDFC Mid Cap Fund is positioned at the lowest historical variability, with standard deviation of 15.92 and beta of 0.85. Its Sharpe ratio of 0.96 is close to the leaders, so its case is not based only on scale.
HSBC and ICICI Prudential show the highest Sharpe ratios at 1.02. Their experiences are not identical: HSBC also has the highest standard deviation and beta, while ICICI Prudential’s beta remains just below one.
Edelweiss combines below-one beta with a Sharpe ratio of 0.96. Invesco India has strong return evidence but higher variability, which may matter to investors who are likely to exit during a difficult mid-cap phase.
Portfolio Construction Explains Part of the Difference

All six official AMC descriptions identify the schemes as open-ended equity funds predominantly investing in mid-cap stocks. That common label still leaves room for different portfolios.
The dated allocation snapshot shows:
- HSBC with about 72% in mid-cap stocks and about 22% in small caps, giving it the lowest large-cap allocation among the six.
- ICICI Prudential with about 71% in mid caps and 16% in small caps.
- Edelweiss with about 69% in mid caps and a more even large- and small-cap balance.
- Nippon India with about 66% in mid caps and the highest large-cap allocation in the shortlist.
- HDFC with about 65% in mid caps, roughly 19% in small caps and a larger non-equity allocation than the others.
- Invesco India with about 64% in mid caps and meaningful exposure on both sides of the market-cap spectrum.
These differences can affect upside participation, drawdowns and liquidity. The percentages are dated and must be rechecked in the latest AMC portfolio disclosure.
Six Schemes, Six Research Questions
Nippon India: does scale support the process?
The scheme combines the highest 5-year return in the shortlist with ₹47,415 crore of AUM and the second-lowest dated expense ratio. Its official page describes a research-based approach to long-term capital growth. Investors should examine whether the current portfolio remains sufficiently liquid and differentiated at this scale.
HDFC: is lower variability the priority?
HDFC has the largest AUM by a wide margin and the lowest beta and standard deviation in the group. The trade-off is that it does not lead the return columns. Its profile may be relevant when an investor values a comparatively steadier mid-cap experience, while still accepting very-high equity risk.
Edelweiss: can a balanced profile remain consistent?
Edelweiss does not dominate one metric, but it scores well across medium- and long-period returns, below-one beta and risk-adjusted measures. The due-diligence question is whether the current portfolio and multi-manager process continue to support that balance.
Invesco India: are higher returns worth the variability?
Invesco leads the selected group over ten years and ranks near the top over three and five years. Its official May 2026 factsheet reports an actively managed portfolio spread across large-, mid- and small-cap holdings, with a mid-cap majority. Its higher standard deviation means investor behaviour during declines remains part of the decision.
HSBC: can recent alpha persist through a full cycle?
HSBC shows the highest 3-year return, alpha and standard deviation in the shortlist. The official AMC page notes that the scheme was formerly L&T Midcap Fund. Investors should review portfolio concentration, manager continuity and the effect of higher small-cap exposure before extrapolating recent results.
ICICI Prudential: does risk-adjusted strength justify the cost?
ICICI Prudential combines alpha of 4.02, a Sharpe ratio of 1.02 and beta of 0.99. It also has the highest dated expense ratio and smallest AUM among these six. Current TER and portfolio disclosures should be checked before deciding whether the historical risk-adjusted evidence remains compelling.
Current AMC Documents Matter More Than a Static Rank
Official AMC pages confirm that these are mid-cap schemes, but current disclosures can differ from a dated comparison.
One visible example concerns Invesco India Midcap Fund: the comparison snapshot lists Nifty Midcap 150 TRI, while the official May 2026 Invesco factsheet identifies BSE 150 Midcap TRI. Investors should use the current Scheme Information Document and factsheet for the applicable benchmark.
Expense ratios, AUM, managers, holdings, market-cap allocation, exit loads and Riskometers can also change. A ranking should therefore start a due-diligence process, not end it.
A Practical Selection Sequence
- Decide whether a very-high-risk mid-cap allocation is suitable at all.
- Define the fund’s role and minimum holding horizon.
- Compare 3-year, 5-year and 10-year periods instead of one recent return.
- Read standard deviation, beta, Sharpe and Sortino alongside returns.
- Check the latest regular and direct plan expense ratios.
- Review current market-cap mix, sector concentration and top holdings.
- Read exit-load, taxation and Riskometer disclosures.
- Compare the scheme with the rest of the household portfolio to avoid hidden overlap.
For general investment-service information, visit Abhipra Services.
Reviewed by Abhipra Research / Compliance Team.
Official Scheme Sources
- Nippon India Growth Mid Cap Fund
- HDFC Mid Cap Fund
- Edelweiss Mid Cap Fund
- Invesco Mutual Fund factsheets
- HSBC Midcap Fund
- ICICI Prudential Midcap Fund
- AMFI Investor Corner
- SEBI Investor website
Data and Risk Disclosure
The quantitative comparison is a dated snapshot as of 21 June 2026 covering active regular growth plans. Returns of one year and longer are shown as annualised figures. Expense ratios, AUM, portfolios, managers, benchmarks, ratings and risk measures can change. Direct-plan figures differ from regular-plan figures.
Historical returns and quantitative scores are not forecasts. Mutual fund investments are subject to market risks. Read all scheme-related documents carefully. This article is for investor education and does not constitute personalized investment advice, a recommendation, a rating or a return guarantee.