
A large-cap fund is often expected to do a simple job: give an equity portfolio a foundation of established Indian companies. Yet a comparison of 41 schemes as of 19 June 2026 shows that funds carrying the same category label can produce very different investor experiences.
Some have built their case through long-period consistency. Some have delivered stronger recent alpha with more volatility. Others have stayed closer to the market and may suit investors who value a steadier core. The useful question is therefore not, "Which fund is number one?" It is, "Which evidence matters for the role this fund must perform in my portfolio?"
How the field was narrowed
The 41 schemes reviewed include active funds, index funds, ETFs and fund-of-funds products, as well as schemes without enough history for a full-cycle comparison. Mixing them would reward incompatible structures. We therefore considered all 41 schemes but separated passive and fund-of-funds strategies, duplicate variants and schemes without observed medium-term history.
The main comparison uses five active growth schemes with observed 3-year, 5-year and 10-year returns. Quant Large Cap Fund is included separately as a shorter-history contrast because its 3-year record and risk metrics are notable, but no observed 5-year or 10-year return was available for it as of the comparison date. No missing return has been estimated.
Selection considered multi-period returns, alpha, beta, standard deviation, Sharpe and Sortino ratios, expense ratio, AUM and large-cap allocation. The figures below reflect the large-cap fund comparison as of 19 June 2026 and should be read as a dated research snapshot, not a live quote.
| Scheme | Observed returns | Risk evidence | Cost and scale | Potential portfolio role |
|---|---|---|---|---|
| ICICI Prudential Large Cap Fund Reg (G) | 3Y 13.86% 5Y 13.56% 10Y 13.87% |
Alpha 2.77 Beta 0.92 Sharpe 0.60 |
Expense 1.14% AUM Rs 76,297 crore |
A large, cost-aware core candidate with consistent observed periods. |
| Nippon India Large Cap Fund (G) | 3Y 13.98% 5Y 15.45% 10Y 14.43% |
Alpha 2.81 Beta 0.96 Sharpe 0.59 |
Expense 1.23% AUM Rs 51,660 crore |
A long-period return leader in this dataset, with somewhat higher volatility than ICICI Prudential. |
| DSP Large Cap Fund Reg (G) | 3Y 13.43% 5Y 10.99% 10Y 11.43% |
Alpha 2.34 Beta 0.89 Sharpe 0.56 |
Expense 1.54% AUM Rs 7,175 crore |
A lower-beta contrast for investors examining downside behaviour alongside returns. |
| Invesco India Largecap Fund (G) | 3Y 14.17% 5Y 12.89% 10Y 12.77% |
Alpha 2.40 Beta 1.06 Sharpe 0.54 |
Expense 1.78% AUM Rs 1,749 crore |
A mid-sized consistency case, balanced against higher cost and market sensitivity. |
| HDFC Large Cap Fund (G) | 3Y 11.48% 5Y 12.40% 10Y 12.79% |
Alpha 0.20 Beta 0.95 Sharpe 0.41 |
Expense 1.31% AUM Rs 37,808 crore |
An established core exposure whose case rests more on scale and continuity than recent alpha. |
| Quant Large Cap Fund Reg (G) | 3Y 15.12% 5Y not available 10Y not available |
Alpha 4.44 Beta 1.15 Sharpe 0.61 |
Expense 1.66% AUM Rs 3,281 crore |
A shorter-history, higher-volatility watchlist candidate rather than a full-cycle peer. |
Three return periods tell three different stories
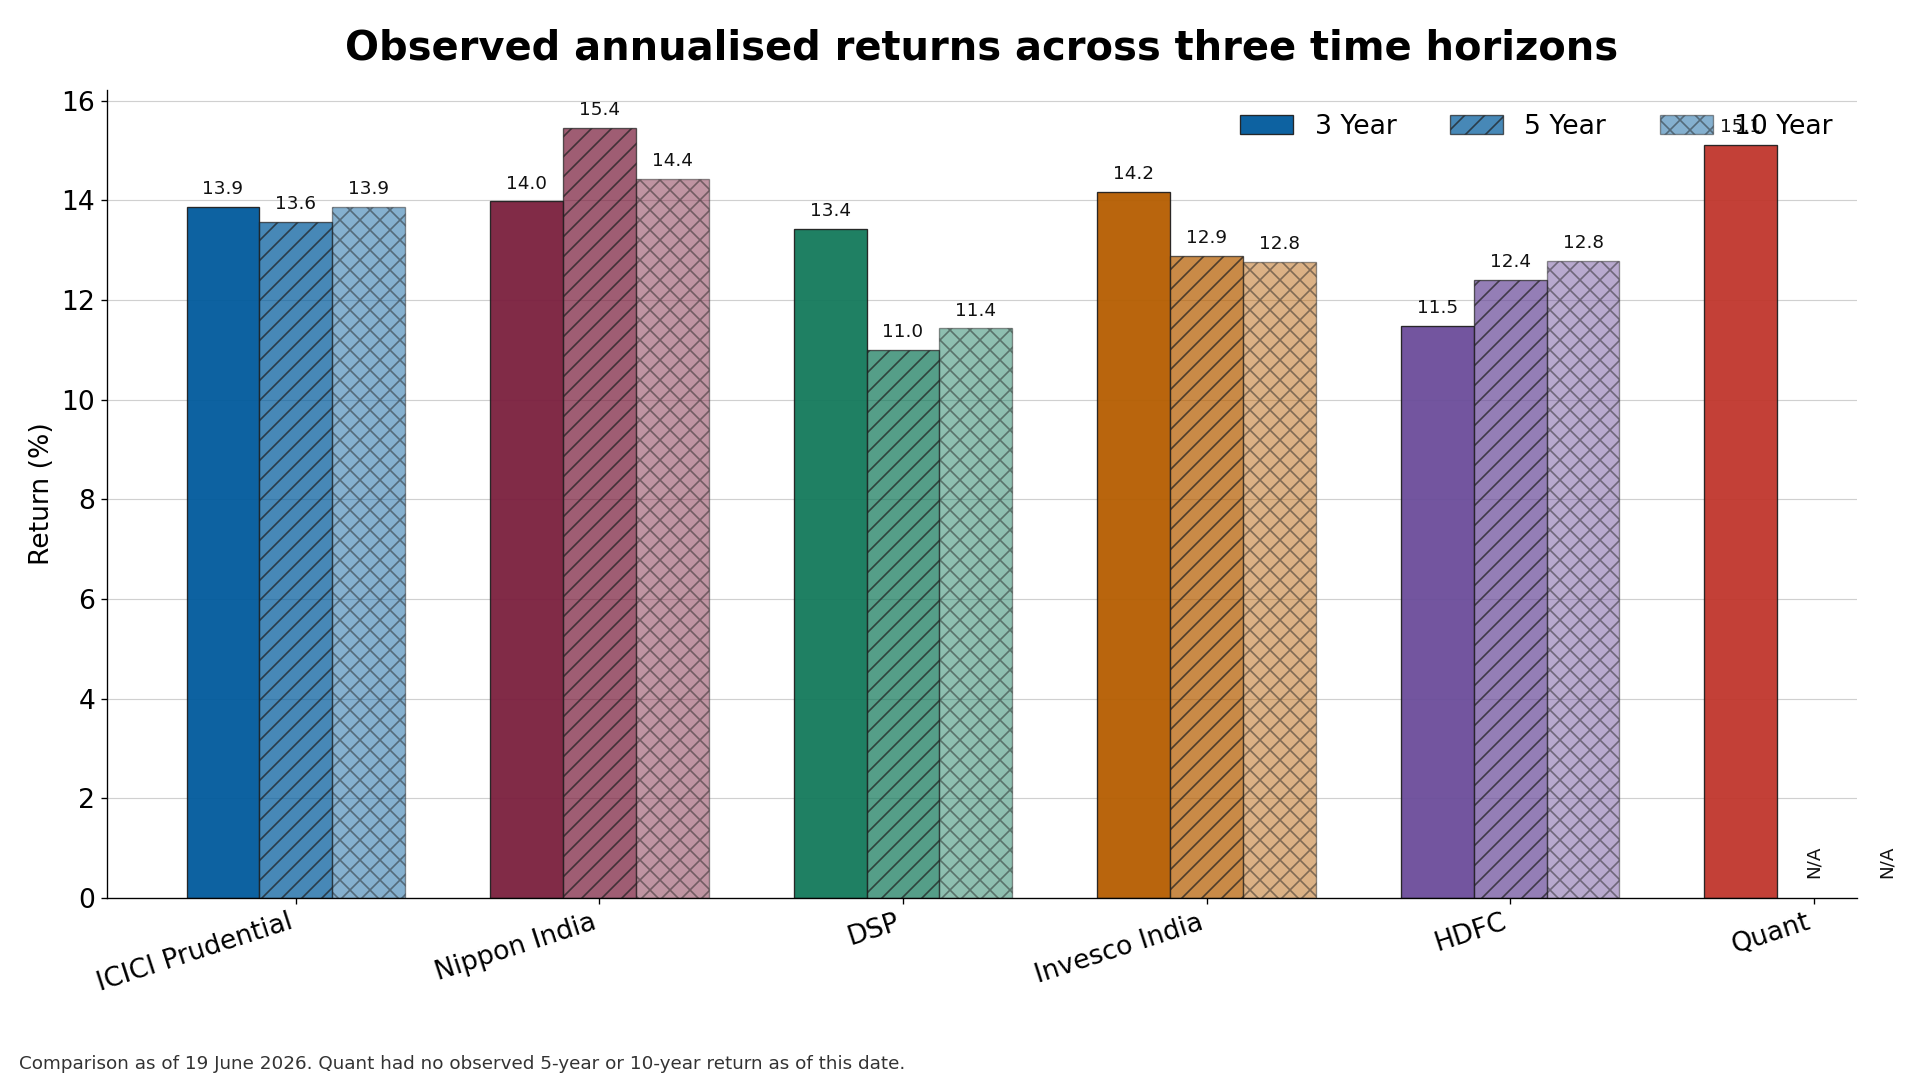
The return chart makes the first trade-off visible. Nippon India Large Cap Fund leads the selected full-history group over five and ten years as of the comparison date. ICICI Prudential Large Cap Fund sits close behind while combining those returns with the lowest expense ratio among these six and the largest AUM.
Invesco India Largecap Fund has a stronger 3-year number than its 5-year and 10-year numbers, while DSP Large Cap Fund shows the opposite editorial lesson: its return figures alone do not explain why it remains interesting. Its lower beta and standard deviation make the risk side of the comparison important.
Quant's 15.12% 3-year return is the highest of the six, but the blank longer periods are not a minor footnote. They mean the scheme has not yet been observed through the same length of market cycle. A recent number should not be allowed to impersonate a long record.
The risk chart changes the order
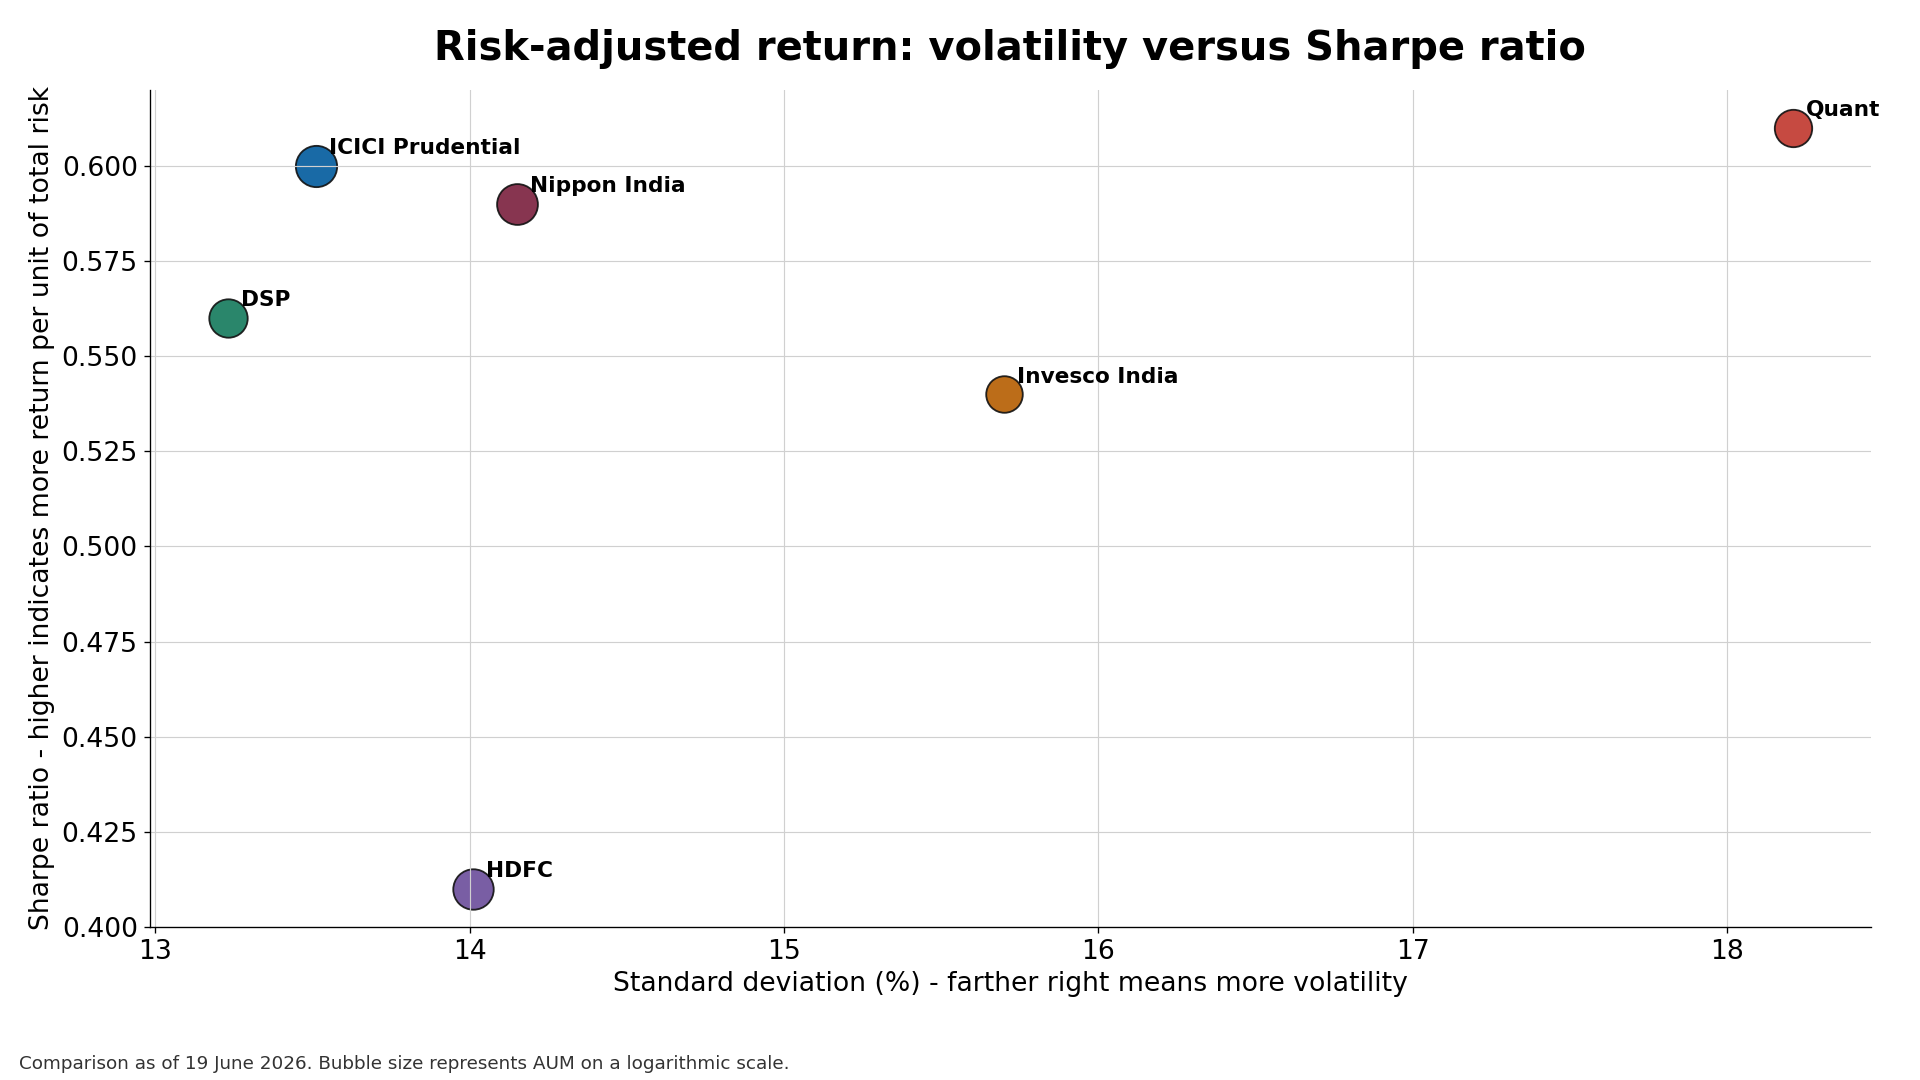
A useful large-cap core should not be assessed only by how high it climbed. Investors also need to ask how much variability accompanied the climb.
Among these schemes, DSP is positioned toward lower volatility with a beta of 0.89 and standard deviation of 13.23. ICICI Prudential combines below-market beta with a Sharpe ratio of 0.60. Nippon India has delivered stronger long-period returns, but at modestly higher standard deviation than those two.
Quant occupies the aggressive corner: high alpha and Sharpe, but also the highest beta and standard deviation among the selected schemes. This does not make it inherently unsuitable. It changes the job it can reasonably be expected to perform and the temperament required from the investor.
Six funds, six investment cases

ICICI Prudential: consistency, scale and cost in one frame
The comparison shows 86.36% in large-cap stocks, a 1.14% regular-plan expense ratio and observed returns clustered between 13.56% and 13.87% across 3, 5 and 10 years. That combination supports a core-fund conversation: not the highest figure in every column, but relatively few obvious compromises within this selected set.
Nippon India: the strongest long-period return record here
Nippon's 15.45% 5-year and 14.43% 10-year returns are the highest among the selected active schemes with full history. Its beta of 0.96 remains below one, although its volatility is above ICICI Prudential and DSP. Investors studying it should ask whether the portfolio process that produced the historical edge remains suitable for their horizon, rather than extrapolating the numbers.
DSP: the defensive evidence deserves attention
DSP's 5-year and 10-year returns trail the two leaders, but its beta of 0.89, standard deviation of 13.23 and Sortino ratio of 0.78 tell a different story. For an investor comparing how funds behaved per unit of downside risk, those figures may be more relevant than a single return rank.
Invesco India: consistency from a smaller asset base
Invesco combines 14.17% over three years with 12.89% over five years and 12.77% over ten years. The trade-offs are visible too: its 1.78% expense ratio is the highest among these six, and beta is above one. Its case therefore depends on whether the investment process and observed consistency justify the additional cost and market sensitivity.
HDFC: an established core with a quieter alpha profile
HDFC's AUM of Rs 37,808 crore and observed 10-year return of 12.79% give it the profile of an established category participant. Its alpha and Sharpe are lower than the comparison leaders. That makes it a useful benchmark for a different investor preference: continuity and broad core exposure rather than the strongest recent risk-adjusted score.
Quant: compelling recent data, incomplete cycle evidence
Quant shows 15.12% over three years, alpha of 4.44 and a Sharpe ratio of 0.61. It also shows beta of 1.15 and standard deviation of 18.21, both the highest among these six. Because no 5-year or 10-year return was available as of the comparison date, it should be compared as an emerging high-activity option, not declared superior to funds with full-cycle records.
A practical selection sequence
Before choosing any large-cap scheme, an investor can use five questions:
- What job will the fund perform? A stable core, a return-seeking satellite or a tactical allocation require different evidence.
- Is the history long enough? Three years can reveal useful information, but it cannot substitute for a full market cycle.
- What did the return cost in risk? Read beta, standard deviation, Sharpe and Sortino with the return columns.
- Is the regular-plan cost justified? Expense ratios compound against the investor every year; compare the current direct and regular plan documents where relevant.
- Does the current portfolio still match the story? Check the latest AMC factsheet for sector concentration, top holdings, cash, market-cap mix, benchmark and riskometer before investing.
The most defensible shortlist is not the one with the highest historical number. It is the one whose mandate, risk pattern, cost and holding period fit the investor's actual plan.
Data, sources and limitations
The quantitative figures reflect the large-cap fund comparison as of 19 June 2026. The schemes shown use regular growth plan figures; direct-plan costs and returns will differ. AUM, expense ratios, holdings, risk measures, ratings and returns change over time.
Scheme mandate and current-document checks should be completed on the official pages for ICICI Prudential Large Cap Fund, Nippon India Large Cap Fund, DSP Mutual Fund, Invesco Mutual Fund factsheets, HDFC Mutual Fund and Quant Mutual Fund. Investors should also read SEBI investor guidance and current scheme documents before acting.
Mutual fund investments are subject to market risks. Read all scheme-related documents carefully. This comparison is for investor education, not personalized investment advice, a rating, or a return guarantee.